
A 90-Day Headline, a 12-Month Campaign: What’s Missing
When a case study’s date range is shorter than the campaign it describes, the missing months matter. Here’s how to check what they show before you trust it.
How to interpret social media results and the numbers behind them
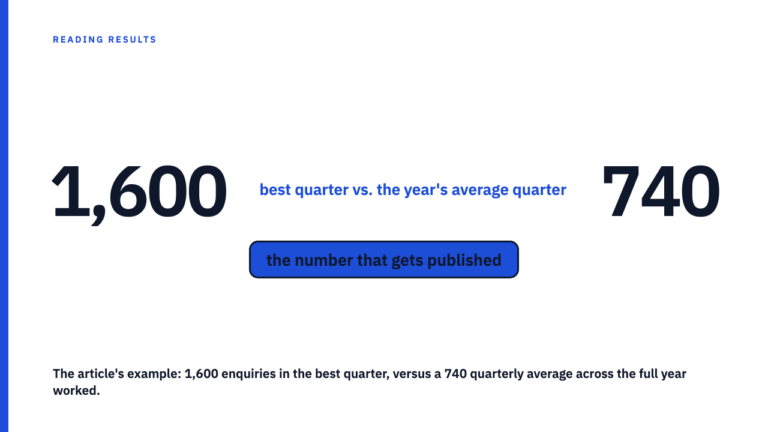
When a case study’s date range is shorter than the campaign it describes, the missing months matter. Here’s how to check what they show before you trust it.
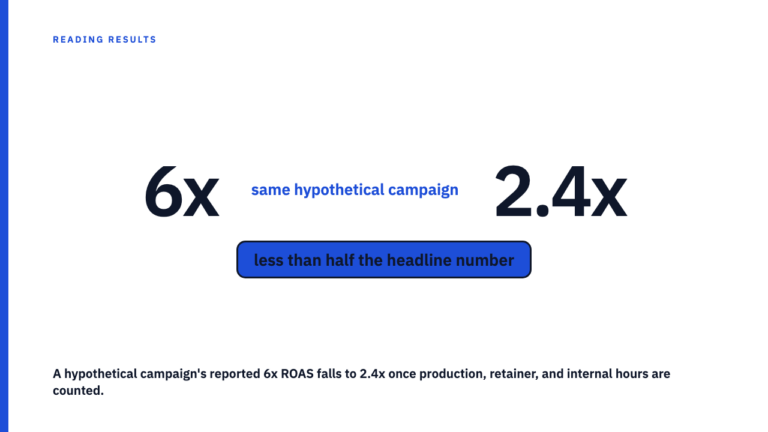
A reported ROI nets ad spend against revenue, but production cost, retainer, and internal hours rarely count against it. Here is how to check what did.
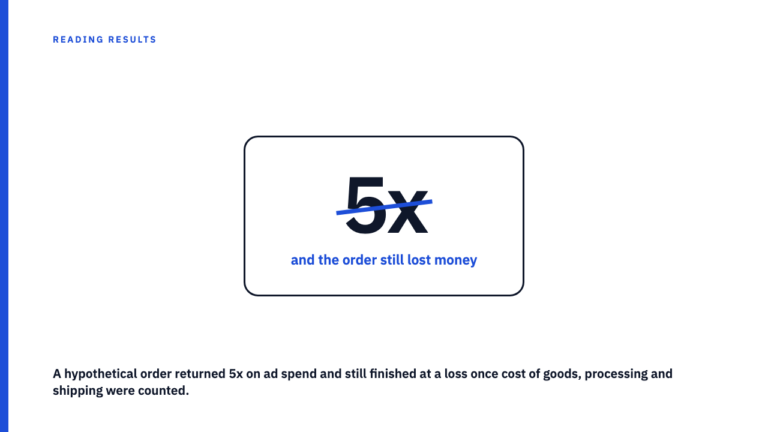
ROAS compares revenue to ad spend, not the cost of goods, fees, or fulfilment. Here is how to check if a reported return multiple left an actual profit.
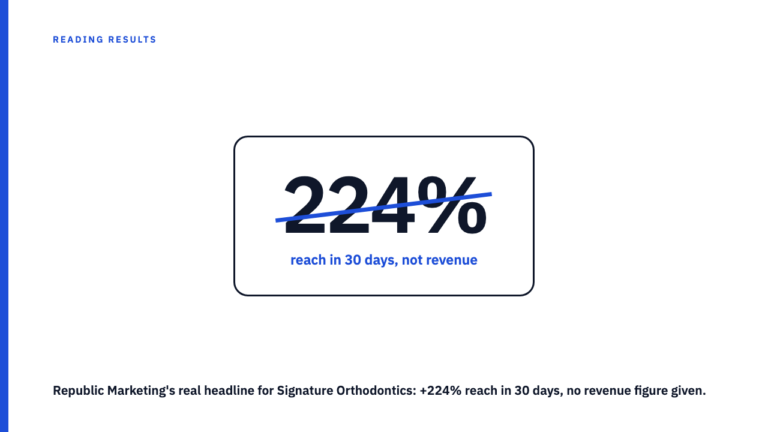
Case studies choose which number leads before you read the campaign. Learn to read that choice and see what a vanity metric headline can’t actually show you.
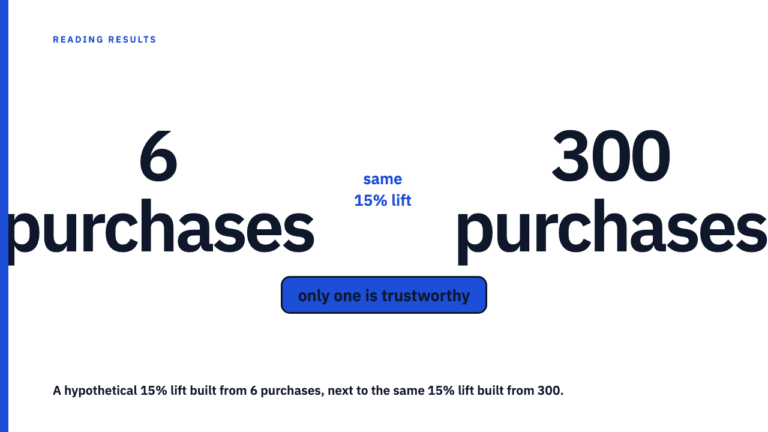
A case study names the winning variant and the percentage lift. Learn what duration, sample volume and repeated peeking tell you before you copy the change.
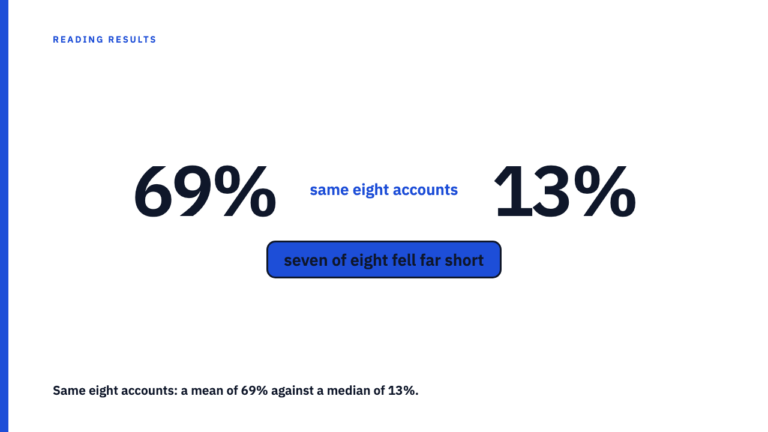
An agency’s average result across a portfolio can be one exceptional account pulling the whole number up. The mean versus median question exposes it fast.
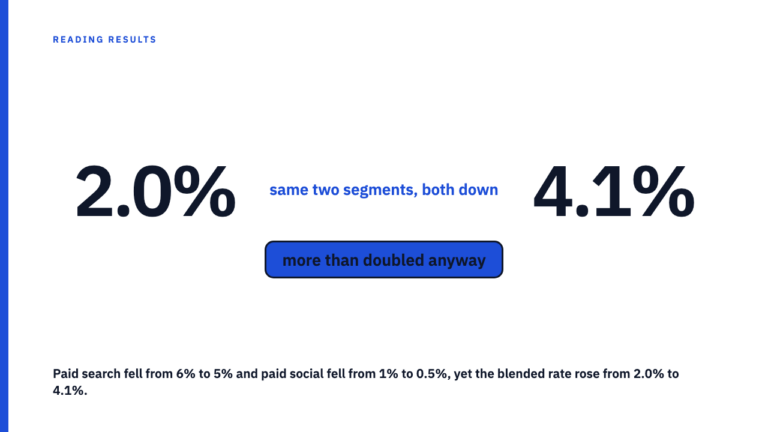
A blended total can rise while every segment behind it gets worse. Walk through a checkable example and the single question that exposes it every time.
A screenshot, a platform export, and a bare prose claim are not the same evidence. Here is how to sort case study numbers by how checkable they really are.
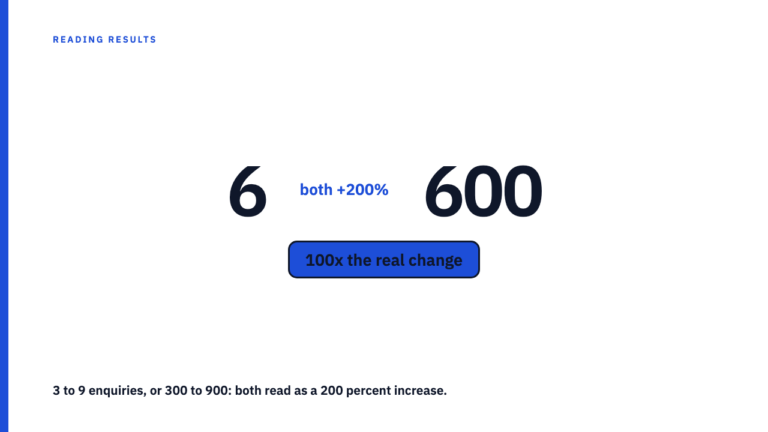
A 200 percent jump can be six enquiries. Here is the rule of thumb for spotting a percentage built on too small a base, and what counts to ask for instead.
Some case studies label a result organic while paid amplification ran the same week. Here is how to spot the gap and read the claim correctly yourself.