One Outlier Account Can Skew an Agency’s Portfolio Average
An agency deck says “an average result across our clients” and puts a number beside it. The number is very likely true. That is what makes portfolio claims harder to read than single case studies: nobody has to lie for one to mislead you about what a typical client got.
What “average result across our clients” is actually claiming
In everyday use “average” just means something like usual. In arithmetic it is not loose at all. Unless the agency says otherwise, an average is the arithmetic mean: add every account’s result, then divide by the count. That definition names the vulnerability: every account contributes its full magnitude to the total, so any one can pull the result in its direction as hard as its size allows.
A portfolio claim is also a different claim type. A case study reports one account; an average reports a group, and claims about groups inherit the statistical behaviour of groups, starting with sensitivity to outliers. A mean tells you where the total sits, not whether the accounts inside it resemble one another. Reading it as a promise of typical performance is a leap the number never authorises, which is why it belongs with how to read a case study without being misled.
A hypothetical portfolio: same eight accounts, two honest summaries
What follows is invented: no real agency, no real client, no real case study, here or anywhere else. Picture a hypothetical agency with eight accounts on one service line, each reporting a year of engagement lift: 8%, 9%, 11%, 12%, 14%, 15%, 20%, and 460%.
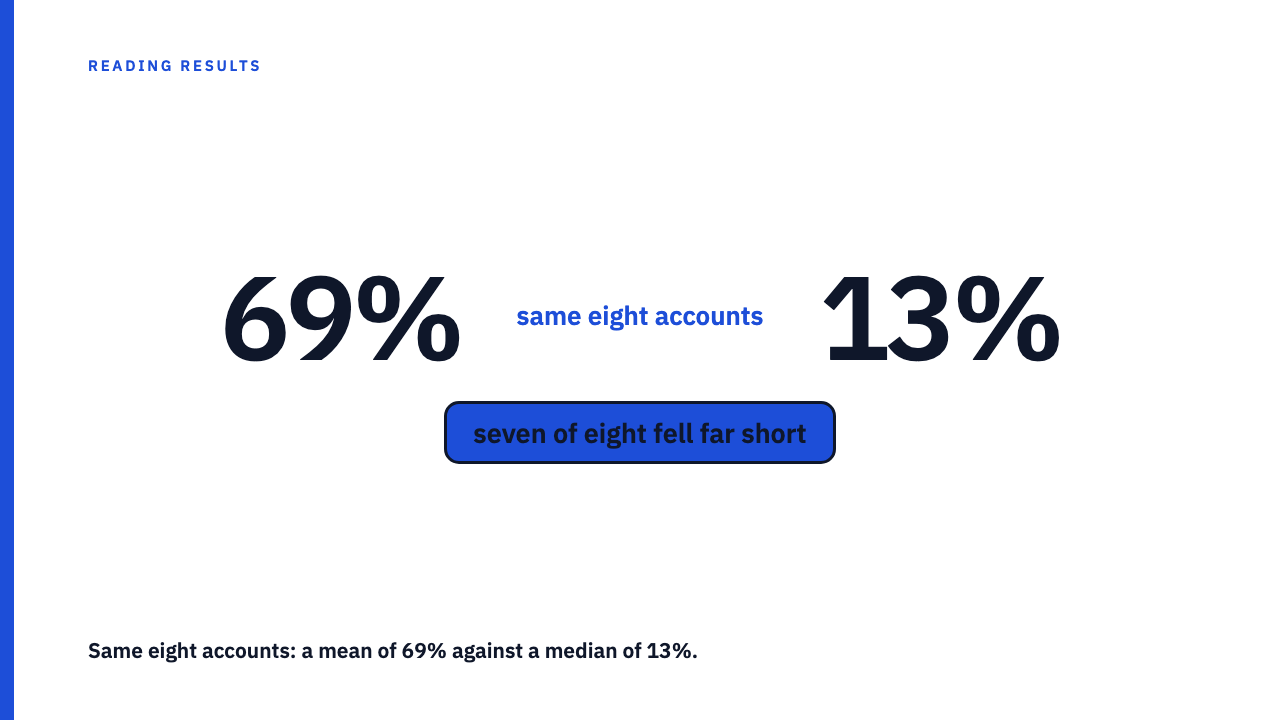
Those eight values sum to 549. Divide by eight and the arithmetic mean is about 69%. Now sort them and take the middle: with an even count you average the fourth and fifth values, 12% and 14%, giving a median of 13%. Both numbers are correct, and both describe the exact same eight accounts. This hypothetical agency reporting “an average 69% lift across our clients” would be technically accurate about a portfolio where the typical client experience was roughly 13%. Seven of the eight did not reach even a third of the headline figure.
Why one account can move the mean this far
The mean is a sum divided by a count, so the 460% contributes its entire size to the total before the division. Drop it, average the remaining seven, and the mean falls to about 13%, where the median already was. The median never moved, because it cares only which value sits in the middle position, not how large the extreme one is.
Percentage lift figures are unusually prone to this. On the downside they are floored near minus 100%, because an account cannot lose more than everything it had. On the upside they have no ceiling: a launch, one post that travels further than anyone planned, or a base so small that a modest gain reads as a huge one. A hard floor with no ceiling grows a long right tail. The NIST Engineering Statistics Handbook gives the rule: a skewed distribution pulls the mean toward the skew, while extreme tail values leave the rank-based median alone. This is not specific to social media or any one platform. It is a property of averaging anything across a group.
The questions that reveal whether an average is representative
- What is the median, not just the mean? If the two sit close together the portfolio is uniform. If they are far apart, one account is doing disproportionate work.
- How many accounts is the average drawn from? One outlier distorts an average of eight far more than an average of eighty.
- What is the range? The lowest and highest result tell you more in two numbers than the mean does in one.
- Is the standout account included, and what does the average look like without it? An agency that has run this arithmetic answers immediately.
- Over what period, and for which service line? An average pooled across paid, organic, and community work over four uneven years is a different object from one service line in one year.
When a portfolio average is doing honest work
Where results genuinely cluster together a mean is the right number to lead with, and the clustering is itself what a spread would show.
The misleading pattern is a bare mean standing alone: no median, no range, no account count. The honest pattern supplies at least one. “Median 13%, mean 69%, across eight accounts” is a different document from “average 69% lift”, on identical data. The mean is not the problem. An undisclosed spread is, the same instinct behind why the best metric on a dashboard is rarely the real story.
How this differs from a single case study’s small base problem
A small base problem lives inside one account: when the starting number is tiny, that account’s percentage is unstable, and a few extra interactions produce a figure that would not survive a repeat month. A portfolio average problem lives across a group: every account’s number can be solid and the summary is still unrepresentative, because one member is far larger than the rest.
So they call for different questions. For one account’s headline number, ask about the base it was calculated from, the ground covered in when the base is small, the percentage is just noise. For a claim about a whole roster, ask about the spread across accounts. Add regression to the mean and most results claims become readable.
Read some real ones
The reflex builds fastest on published work with these questions in hand. Browse the case study library, each entry credited to the agency that reported it, or submit your own.
FAQ
What’s the difference between a mean and a median in this context?
The mean adds every account’s result and divides by the count, so one very large result contributes its full size and pulls the answer upward. The median is the middle value once results are sorted, so it reflects the typical account however extreme the extremes are.
What if the agency will not share the median or the account count?
Treat the refusal as the answer. An agency whose average genuinely reflects typical performance loses nothing by showing the median. Withholding the one number that would settle it is informative in itself, though it does not require bad faith. Plenty of agencies have never run the calculation.
Sources
- NIST/SEMATECH e-Handbook of Statistical Methods, 1.3.5.1 Measures of Location, fetched 5 September 2026.
- NIST/SEMATECH e-Handbook of Statistical Methods, 1.3.5.6 Measures of Scale, fetched 5 September 2026.