How to Read a Marketing Case Study Without Being Misled
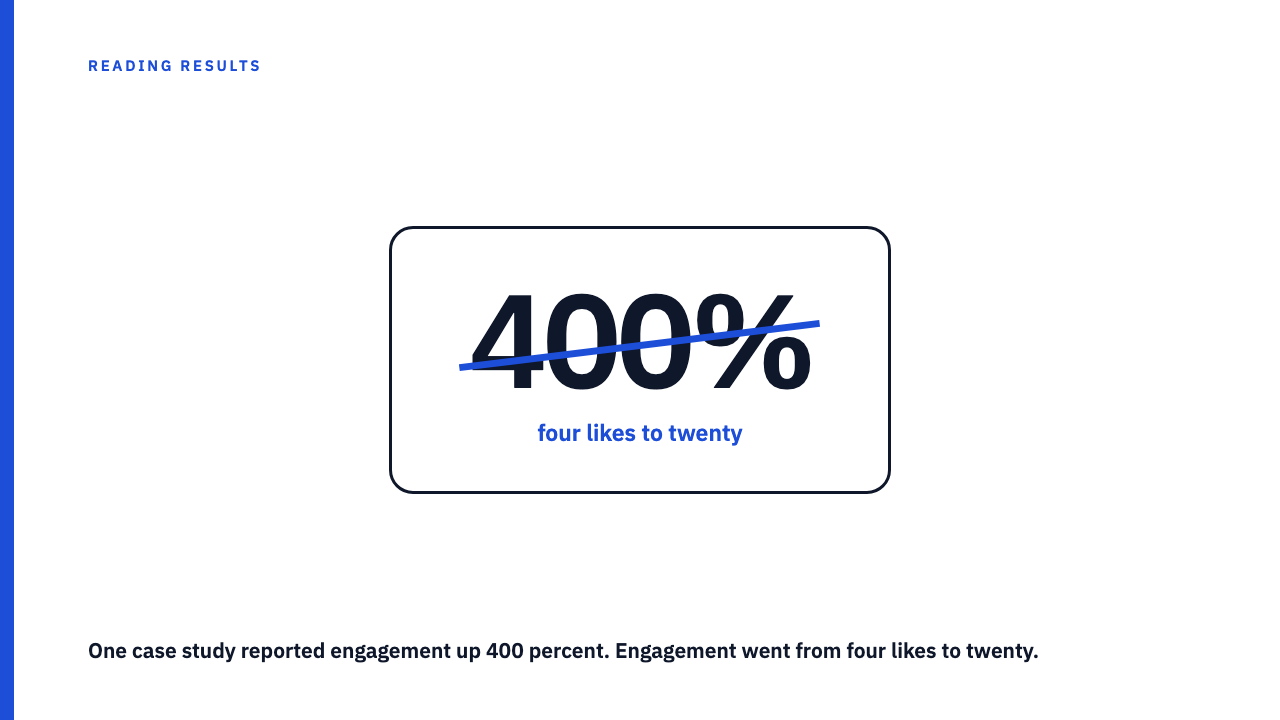
A case study says engagement grew 400 percent. It doesn’t say engagement went from four likes to twenty. Both statements are true. Only one of them tells you anything useful about whether to hire that agency. Reading marketing case studies well means learning to ask what’s missing before you get impressed by what’s shown, because the version presented to you was written by the people with the most to gain from your believing it.
The percentage that means nothing without a denominator
Percentages are the easiest number to manipulate honestly. You don’t have to lie, you just have to pick a small starting point. A follower count that goes from 200 to 2,000 is a 900 percent increase and also a rounding error next to any brand that matters in its category. A case study that leads with a percentage and never states the underlying volume is not necessarily lying to you, but it is choosing not to tell you something it clearly knows.
Picture a boutique fitness studio that hires an agency to run its Instagram. Three months later, the case study reports “engagement up 340 percent.” What it doesn’t say is that the account had 40 followers when they started and posting simply hadn’t happened before. Getting from 40 to 400 followers is real work and might be exactly what that client needed. But it is a different achievement than what the same percentage would represent for an account with 40,000 followers, and the case study wants you to feel the size of the number, not the size of the base.
The fix, as a reader, is simple: never accept a percentage without asking for the raw numbers on both ends. If a case study won’t give you both, treat the percentage as marketing copy, not evidence.
Baselines: what were they before, and were they doing anything at all?
A baseline isn’t just a number, it’s a description of effort. An account that posted twice a month with no strategy is going to show dramatic movement from almost any competent intervention, because the bar was on the floor. That’s not fraud. It’s also not proof the agency is good at anything beyond showing up more consistently than nobody.
Good case studies describe the baseline period honestly: what was being posted, how often, and what wasn’t working about it. A study that says “the brand had no consistent posting cadence and no paid support” before the engagement changed is giving you context you can weigh. A study that jumps straight from “the challenge” to “the results” without describing the starting state is asking you to assume the baseline was reasonably healthy. Don’t assume that. Ask.
Timeframes and the cherry-picked window
Every metric has a shape over time, and every shape has a best three weeks in it. If an agency can choose which weeks to report, they can almost always find a window that looks better than the average. This is the single easiest way a technically true case study becomes a misleading one.
Watch for these patterns:
- A campaign is described as running “over six months” but the results section only cites numbers from a specific week or launch moment within that window.
- Results are reported as a comparison to “the same period last year” without explaining why that period is the right comparison, especially around seasonal businesses where last year’s slow month is an easy baseline to beat.
- A single viral post drives the entire headline number, and the case study reports account-wide averages that include it rather than showing what performance looked like without it.
None of this means the work was bad. A viral post is still a result, and results within a good window are still results. The problem is when the window is presented as representative of ongoing performance rather than as the peak it actually was. A trustworthy case study will tell you what the account did the month after the spike, not just the month of it.
Correlation wearing attribution’s clothes
Sales went up during the campaign. So did foot traffic, so did brand search volume, so did three other things the agency wasn’t touching. Case studies routinely present a metric moving in the right direction next to a description of the work, and let the reader’s brain draw the causal line for them. Sometimes that line is correct. Often it’s one plausible explanation among several, competing with a product launch, a seasonal shift, a competitor closing, or a press mention nobody thought to mention.
The stronger the case study, the more it rules things out. It’ll tell you what else was happening during the campaign window and why the agency believes their work, specifically, drove the number rather than rode alongside it. If a case study never acknowledges that other things could have contributed, that’s not because nothing else happened. It’s because acknowledging it would weaken the pitch.
What a trustworthy case study actually looks like
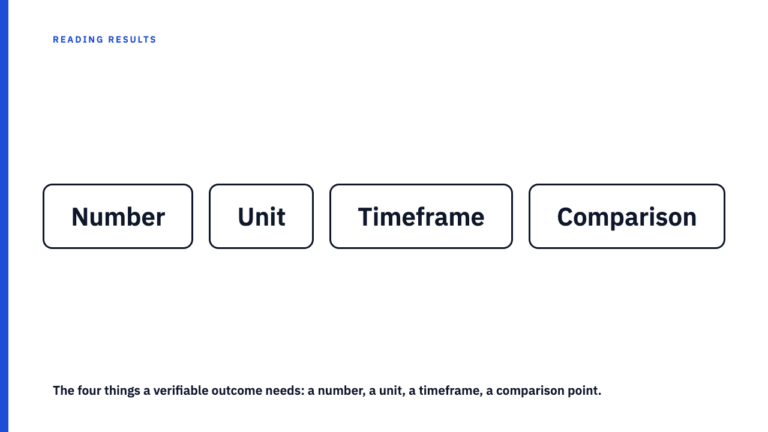
It states the starting numbers, not just the ending ones. It names the time period plainly, including whether the reported result was a peak or a sustained average. It explains what changed operationally, the actual work done, not just the outcome. It’s specific about the client’s situation rather than describing “a leading brand in the space,” which usually means the client asked to stay vague or the agency prefers you not check. And it’s willing to include a metric that didn’t move much, because a study that reports universal success across every single number it mentions is a study that only mentions the numbers that cooperated.
None of this requires an agency to publish its client’s entire analytics dashboard. It requires enough specificity that a skeptical reader could, in theory, ask a clarifying question and get a real answer rather than a rephrased headline number.
Read the library, then decide for yourself
Social Case Studies exists because most published case studies are written to close deals, not to inform buyers, and the two goals only sometimes overlap. Every case study in the library is credited to the agency that produced it, so you know exactly whose claims you’re evaluating and can compare how different agencies describe their baselines, timeframes, and denominators when they’re talking about similar work. Browse the case study library to see how the strongest ones handle the questions above, or submit your own if you’re an agency willing to show your numbers, not just your best percentage.
FAQ
Is a case study without raw numbers automatically untrustworthy?
Not automatically, but it should lower your confidence. Some clients require anonymization or won’t allow specific figures to be published, and an agency working within that constraint isn’t necessarily hiding anything. The difference is whether the agency acknowledges the limitation and gives you enough surrounding context, like the shape of the change and the timeframe, versus using vagueness as a way to avoid a claim that wouldn’t hold up if the numbers were shown.
What’s the fastest way to sanity check a case study before a sales call?
Ask for the starting metric alongside the ending metric, the exact date range the results cover, and what else was happening in the client’s business during that window, like a product launch or a seasonal spike. An agency that can answer all three quickly, with specifics rather than reworded talking points, is describing something real. Hesitation or a pivot back to the headline percentage is itself useful information.