
One Journey, Three Attribution Models, Three Different Heroes
Last touch, first touch and linear models can credit different channels for one sale. A hypothetical example shows how the model moves social’s share.
How to interpret social media results and the numbers behind them
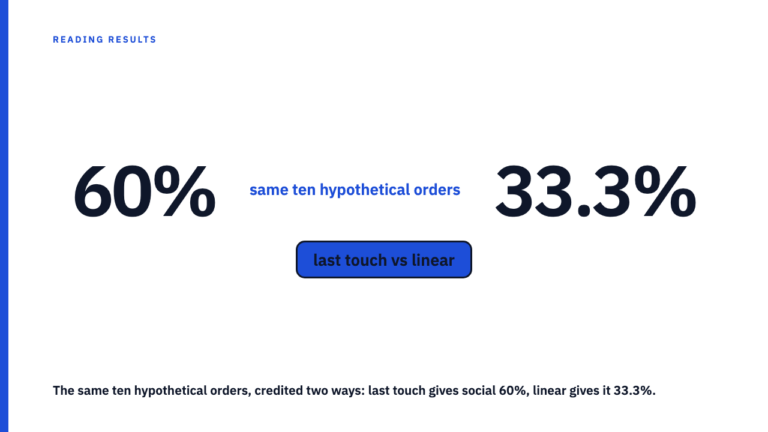
Last touch, first touch and linear models can credit different channels for one sale. A hypothetical example shows how the model moves social’s share.
An MMM output shifts with which channels the analyst includes. Here is what to ask before trusting a case study’s modeled revenue or incrementality figure.
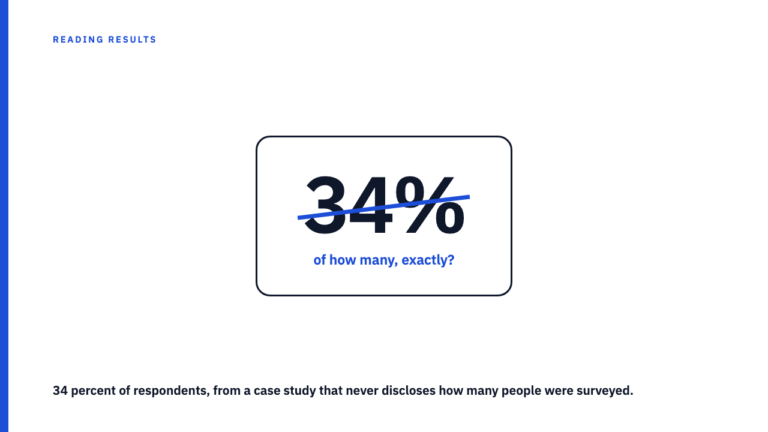
A case study’s brand lift percentage needs a disclosed sample size before it means anything. Here is what that number hides and what to ask for instead.

A four dollar cost per lead sounds great until you learn it bought four leads. Here is how to read a cost-per figure that has no count next to it.

A one-tailed test can push a borderline result over the significance line. Here is when that choice is honest, and when it just manufactures a finding.
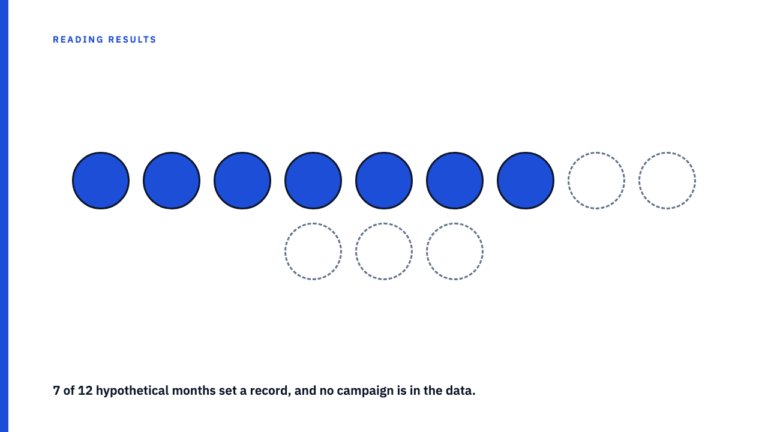
Best month ever is often just what a growing metric does. Learn to tell an impressive record from an inevitable one, with a hypothetical 12 month example.
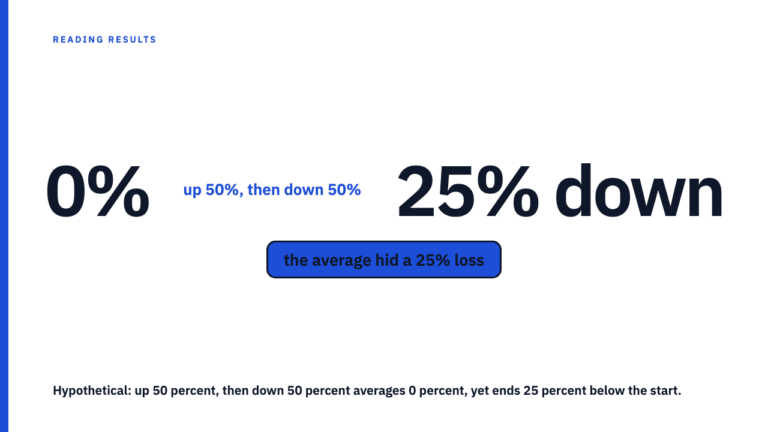
A campaign that gained 50 percent then lost 50 percent ended 25 percent down. Learn why an averaged growth rate misleads and how to check one in a case study.
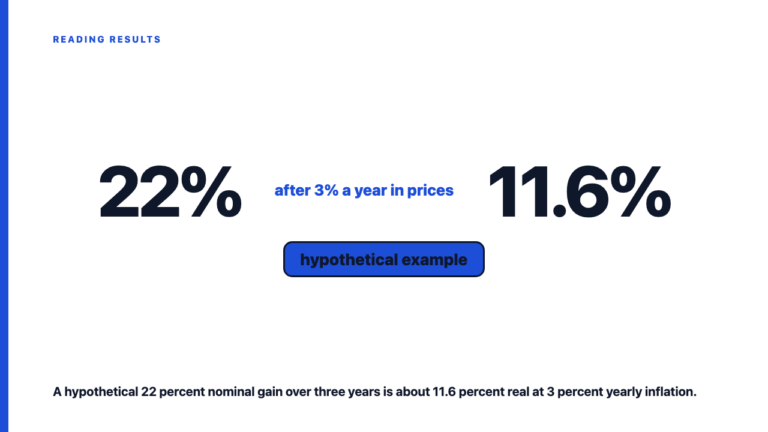
Revenue growth quoted in raw dollars includes inflation the campaign did not cause. Learn the one division that shows how much of a result is real growth.

Agencies report a per-client average or a total across all accounts. Learn why the client count changes what each means, and which questions to ask first.

A backtested result was never delivered, only simulated against past data. How to tell a modeled case study number from a real campaign that actually ran.