Average Per Client or Total Across Clients? Two Different Claims
A results page says “our clients average a 4x return” and stops there. With no client count you cannot tell whether it describes three accounts or three hundred.
Four clients or four hundred
Two claims get mixed up. A per-account average answers “what might one account expect?” A portfolio total answers “how much did the whole book move?” Neither is dishonest on its own. The trouble starts when one headline borrows the credibility of the other.
An impressive average may rest on very few accounts. An impressive total may rest on a very large number of modest ones. Either way the headline never states the count, and the count tells you which question is being answered. You probably want the number to be true. The check is cheap and assumes no bad faith: how many accounts is this?
One headline each, two very different books
Everything in this section is HYPOTHETICAL. The agencies and figures are invented, and none is a reported result. “Return” means revenue per dollar of spend.
HYPOTHETICAL: two invented agencies, invented figures.
| Hypothetical agency | Accounts | Average return per account | Total spend | Total return |
|---|---|---|---|---|
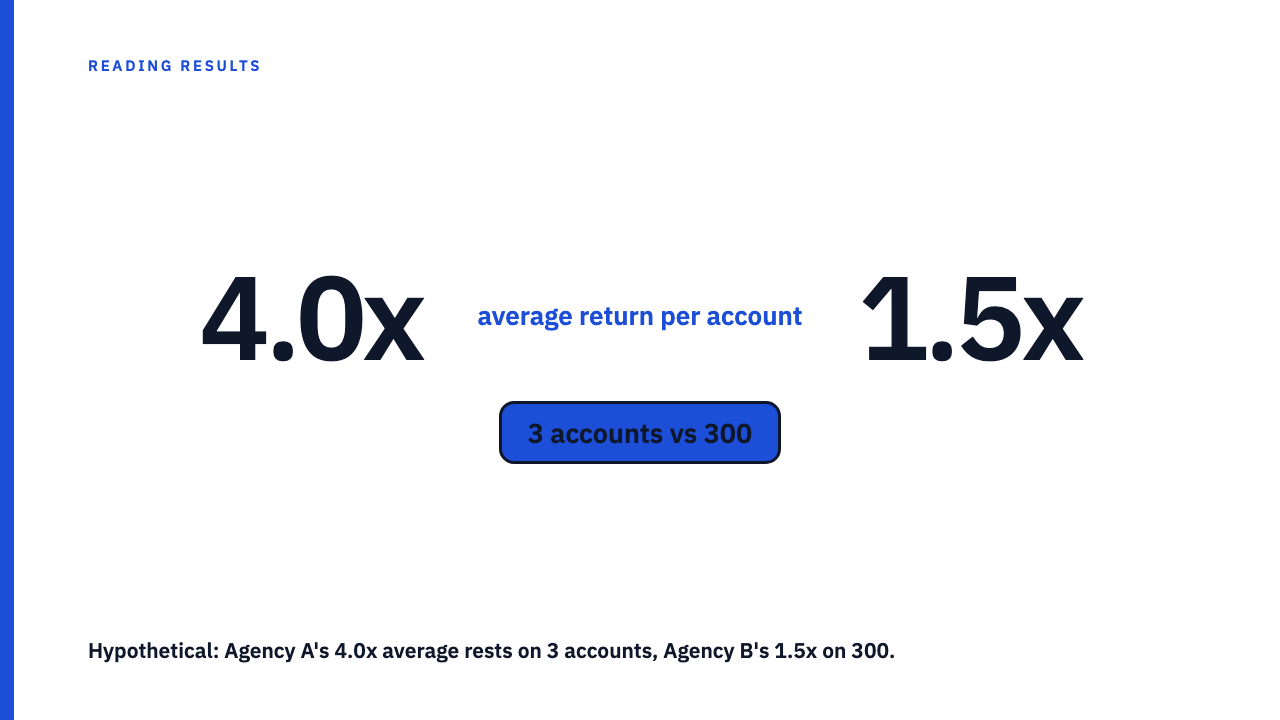
| Agency A | 3 | 4.0x | $30,000 | $120,000 |
| Agency B | 300 | 1.5x | $3,000,000 | $4,500,000 |
Agency A’s three accounts each spent $10,000 and returned 5.0x, 4.0x and 3.0x. The average is 12.0 divided by 3, or 4.0x, and the total is 12.0 times $10,000, or $120,000, on $30,000 spent. Agency B ran 300 accounts at $10,000 each, so $3,000,000 of spend, and 1.5x on that gives $4,500,000.
A can headline “4x average”. B can headline “$4.5 million generated”. Which is more impressive? That has no answer until you say what you want to know. For what one account might expect, A’s 4.0x looks stronger, though it rests on three accounts. For how much the whole book moved, B’s total dwarfs A’s, largely because B is a hundred times bigger. Neither headline answers the other’s question.
A large country has a larger total economy than a small one simply for being larger, which is why per capita figures exist: the phrase means “per person”. Per-person figures then have their own denominator problem, which is the next section. And reading an aggregate as what any single account should expect is the ecological fallacy.
Why a small denominator makes the average fragile
Back to Agency A. Suppose the 3.0x account had come in at 1.0x. The returns are 5.0, 4.0 and 1.0, which sum to 10, and 10 divided by 3 is about 3.3x. One account moved the headline from 4.0x to 3.3x. Dropping the 5.0x account to 1.0x instead gives about 2.7x.
Now run the same swing across Agency B’s 300 accounts. One account falling by 2.0 points changes the sum by 2.0, and 2.0 divided by 300 is about 0.007. Even a 4.0 point fall moves the average by about 0.013.
A small group’s average can be pulled a long way by one member, while a large group’s is steadier. Two terms to search: the standard error of a mean tends to shrink as the sample grows, and the law of large numbers says the average of many independent results converges on the true value. Accounts are only loosely independent draws, so treat both as directions.
A big count does not fix an outlier that dominates a large book: see how one outlier account can skew a portfolio average. The same fragility appears in percentages when the base is small.
Average of accounts, or total divided by accounts?
“The average” hides a second choice. Another HYPOTHETICAL example. Account one spent $1,000 and returned $8,000, which is 8.0x. Account two spent $99,000 and returned $99,000, which is 1.0x.
The simple average of the two ratios is (8.0 plus 1.0) divided by 2, or 4.5x. Total return over total spend is $107,000 over $100,000, or 1.07x. The simple average treats every account as equal. The pooled figure weights each by its money. Neither is wrong, but a headline should say which it is. The pooled version is a weighted mean, which counts some accounts more than others.
The third option is the median, the middle account once ranked. It is not skewed by a small proportion of extreme values, but it hides how large the biggest wins were.
Five questions to ask before you compare two averages
- How many accounts are in the average? A good answer is a number printed beside the figure. Silence means it cannot be compared or projected.
- Was every account the agency ran in the window included, or only some, and if some, who chose? A good answer is all of them, or a rule set before results were known. Silence leaves a possibly selected sample, as when accounts that ended early are dropped. A single win invites the same check: a winner, but out of how many?
- Is it a mean, a median, or a total divided by accounts, and was it weighted by spend? A good answer names the method. Silence means the same data could give 4.5x or 1.07x.
- Do all accounts share the same metric, duration and start date? A good answer is one definition and one window. Silence means unlike things may be blended.
- If the claim is a total, how many accounts and how much spend produced it? A good answer gives both beside the total. Silence leaves a figure that mostly shows how big the book was.
Reading a portfolio claim next to a single case study
A portfolio figure and a single-client case study are different evidence. In this library every number belongs to the agency credited. It is that agency’s own figure, not a benchmark. A total also keeps rising as a book grows even when the rate per account falls, as the post on how cumulative totals can rise while the rate falls explains.
Next time the headline is an average, ask for the count.
Browse the case study library or submit your own.
FAQ
Is a big total across all clients a better result than a strong average per client?
Neither, because they answer different questions. In the hypothetical table, B’s $4,500,000 dwarfs A’s $120,000 mainly because B ran 300 accounts against 3, while A’s higher average rests on three.
What if the agency will not tell me how many clients are in the average?
Treat it as unanchored. The claim may still be true, but it cannot be compared or projected onto your account. Ask questions 1 to 3 above.
Sources
- Standard error, Wikipedia, fetched 2026-09-20
- Law of large numbers, Wikipedia, fetched 2026-09-20
- Weighted arithmetic mean, Wikipedia, fetched 2026-09-20
- Per capita, Wikipedia, fetched 2026-09-20
- Median, Wikipedia, fetched 2026-09-20
- Ecological fallacy, Wikipedia, fetched 2026-09-20