Was That Average Trimmed Before They Reported It?
You are reading a portfolio page and one number is doing a lot of work. The average client saw a 7.8 percent lift, it says, and you file that away as the truth about what this agency delivers. But a single reported average is not one thing. The same set of accounts can produce several different averages depending on how the calculation is set up, and only one gets printed. The question is not whether the number is real. It is which average you were handed, and whether anyone said.
The number on the portfolio page is one of several the data allows
A reported average feels like it falls straight out of the data, as if the accounts added themselves up and divided. They did not. Somebody chose a method. The raw mean, the trimmed mean, and the winsorized mean are three different calculations run on the same dataset, and they can land on three different figures. Each is a legitimate statistical method with a defensible use. None is a trick.
So the problem is not that an agency trimmed its data. The problem is trimming without saying so. A trimmed number reported as if it were the straight average of every account is not a stronger claim than the raw figure, only a quieter one, and the quiet is what misleads.
What trimming and winsorizing actually do to a number
A trimmed mean, sometimes called a truncated mean, drops a set percentage of the highest and lowest values before averaging what is left. A 10 percent trim on ten accounts removes the single worst and the single best, then averages the remaining eight. The neutral definition describes it as the mean taken after discarding parts of the sample at the high and low end, usually an equal amount of both.
A winsorized mean does not discard anything. It replaces each extreme value with the nearest value it decided to keep, then averages the full set, so the worst account is not deleted but reset to the next value up. As the standard definition puts it, in a trimmed estimator the extreme values are discarded, while in a winsorized estimator they are replaced by certain percentiles. Both pull the reported figure toward the middle. One keeps the sample size intact, the other shrinks it.
A worked example with hypothetical numbers
Consider ten accounts, all figures hypothetical and invented purely to show the arithmetic. Read as a percentage change over some baseline, they run: negative 40, negative 25, negative 10, 5, 10, 14, 18, 22, 28, and 33. Three lost ground, one badly.
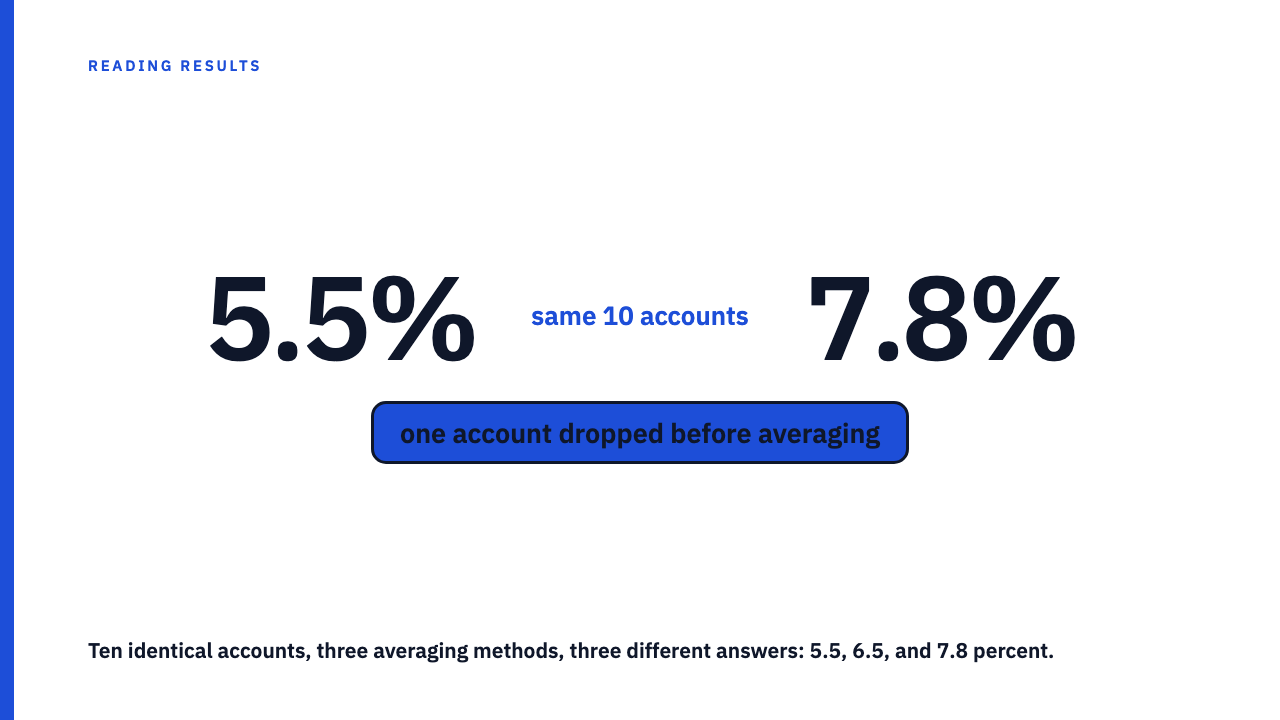
The raw mean adds all ten and divides by ten: the total is 55, so the raw mean is 5.5 percent. The negative 40 account drags it down, which is what a genuine average should let it do. A 10 percent trimmed mean drops the lowest, negative 40, and the highest, 33, then averages the middle eight, which total 62 over eight accounts, or 7.75 percent, rounding to 7.8. The winsorized version keeps all ten but resets the extremes, turning negative 40 into negative 25 and 33 into 28, for a total of 65 over ten, or 6.5 percent.
Three methods, one hypothetical dataset, three answers: 5.5, 7.8, and 6.5. An agency choosing what to print reaches for the trimmed 7.8, because it is the largest and reads as clean. The reader who sees only 7.8 has no way to know one account lost 40 percent, or that it was removed before the number was formed.
How to tell which average you were handed
You usually cannot reverse engineer the method from the number alone. You have to ask. A few specific things to ask for:
- Ask which calculation produced the figure: raw, trimmed, or winsorized? If trimmed, what percentage came off each end?
- Watch the language. Adjusted average, normalised, or excluding outliers with no threshold stated are often a trim wearing a softer word. Excluding outliers is not a method until someone says which outliers and by what rule.
- Look for a median next to the mean. A median offered alongside the average is a disclosure. Its absence is a small silence worth reading.
- Ask how many accounts are in the average and how many were excluded. A trim only bites when you know the denominator. An average of eight labelled as an average of ten tells you the trim happened.
When trimming is honest and when it is not
None of this makes trimming dishonest. A disclosed trim, with a stated threshold and a plain reason, is a reasonable analytical choice, and robust statistics exist precisely because one extreme value can distort an average. The failure is the silence around it: reporting a trimmed 7.8 as though it were the plain average of every client, when the raw figure was 5.5 and the worst account was dropped to get there. The tell is whether the method survives being asked about. An honest number comes with its recipe, and its author can give you the threshold and the count without flinching. You wanted the 7.8 to be true when you read it, and there is nothing wrong with that. Do not assume deception, but check anyway.
Read the rest of the shelf
See how one outlier account can pull a portfolio average up, the mirror image of the move here, and why the reported number is a choice, not a fact. To press further, learn to ask for the numbers behind the number, Browse the case study library, or submit your own.
FAQ
Is trimming outliers before reporting an average dishonest?
No. Trimming is a legitimate statistical method, with sound reasons to reduce the pull of one extreme account. The dishonesty, when it happens, is not disclosing it. A trimmed figure presented as the plain average of every client lets the reader believe they are seeing all the accounts when the worst were removed first. State the trim and its threshold and the same calculation becomes honest.
What is the difference between a winsorized mean and a trimmed mean?
A trimmed mean removes the extreme values entirely and averages what remains, so the sample gets smaller. A winsorized mean keeps every value but replaces each extreme with the nearest value it retained, so the sample size stays the same. Both reduce the influence of outliers, but trimming discards the extremes while winsorizing rewrites them, which is why the two can give different answers on the same data.
Sources
- Truncated mean, Wikipedia, fetched 2026-09-11.
- Winsorizing, Wikipedia, fetched 2026-09-11.