
A Disclosed Sample Size Can Still Hide Who Was Surveyed
A case study can cite ‘n=500’ and still never say who those 500 people were. Here is why a sample size without a sampling method is only half a disclosure.
How to interpret social media results and the numbers behind them
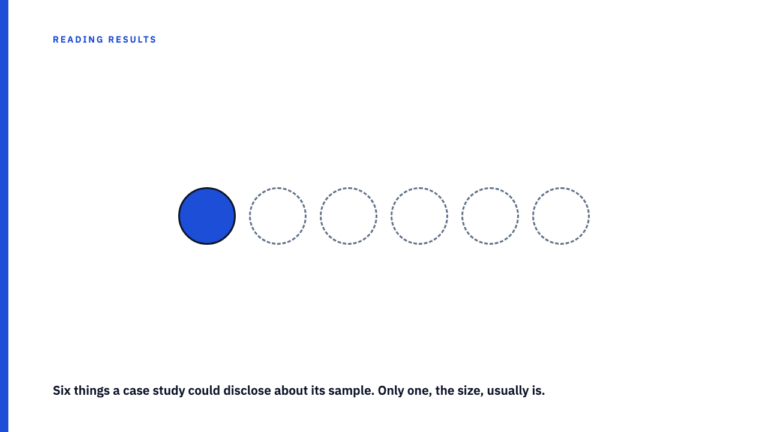
A case study can cite ‘n=500’ and still never say who those 500 people were. Here is why a sample size without a sampling method is only half a disclosure.
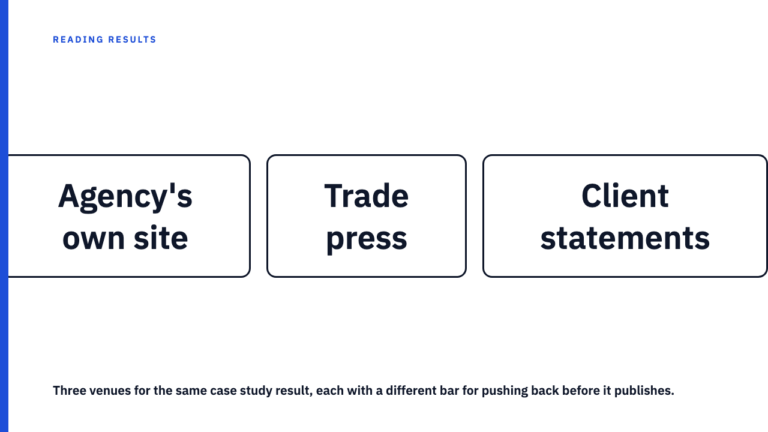
When an agency publishes its own case study, it alone chose the framing and the metric. Here’s how to weigh that against independently reported results.
Adding view counts from YouTube, Instagram, and TikTok looks like audience reach, but here is why that summed total almost always counts viewers twice.
A Google Trends chart in a case study is scaled to its own peak, not a count of searches. Here is what that 0 to 100 axis actually proves about reach.
A headline reading ‘up to 40 percent’ states the single best case in the data, not the typical one. Here is what that phrase leaves out, and what to ask next.
A brand favorability index or quality engagement score sounds rigorous, but if the term appears nowhere else, there is no definition to check it against.
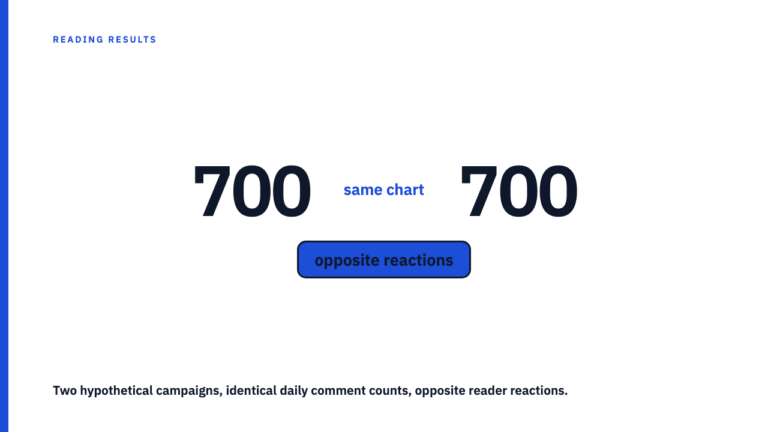
A comment spike looks identical whether readers loved the post or came to tear it apart. Here is the sentiment check the spike still needs to count as a win.
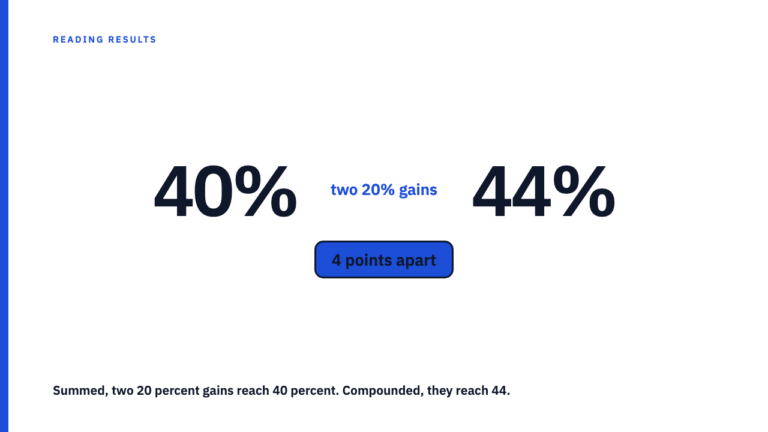
A case study that adds sequential percentage gains into one total overstates the result. Here is the correctly compounded number, worked through side by side.
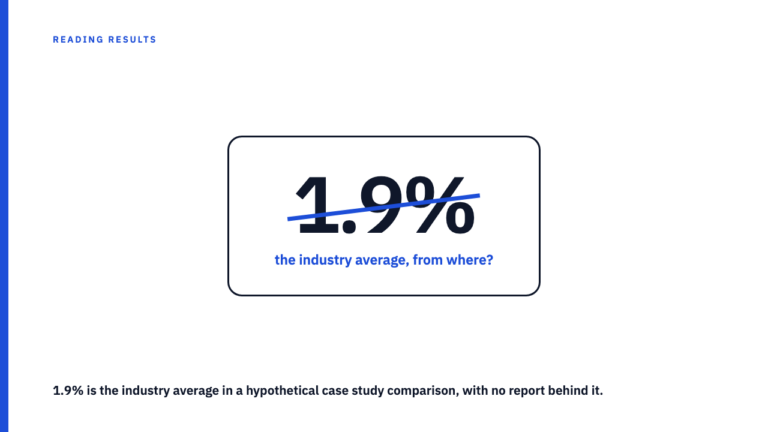
Case studies love an uncited industry average to make their lift look bigger. Here is how to tell a traceable benchmark from a floating number.
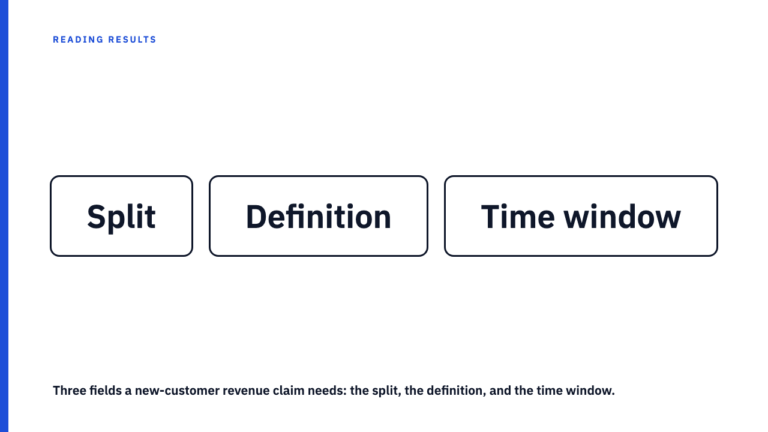
A sales increase during a campaign window can be repeat purchases a retention email was already driving. Here is the split a revenue claim needs to hold up.