A Lopsided Test Split Is a Warning About the Test
A case study says an A/B test split users evenly, then the results table shows two groups of different sizes. Whether that gap matters is arithmetic, and two published numbers are enough.
The moment the numbers do not match the design
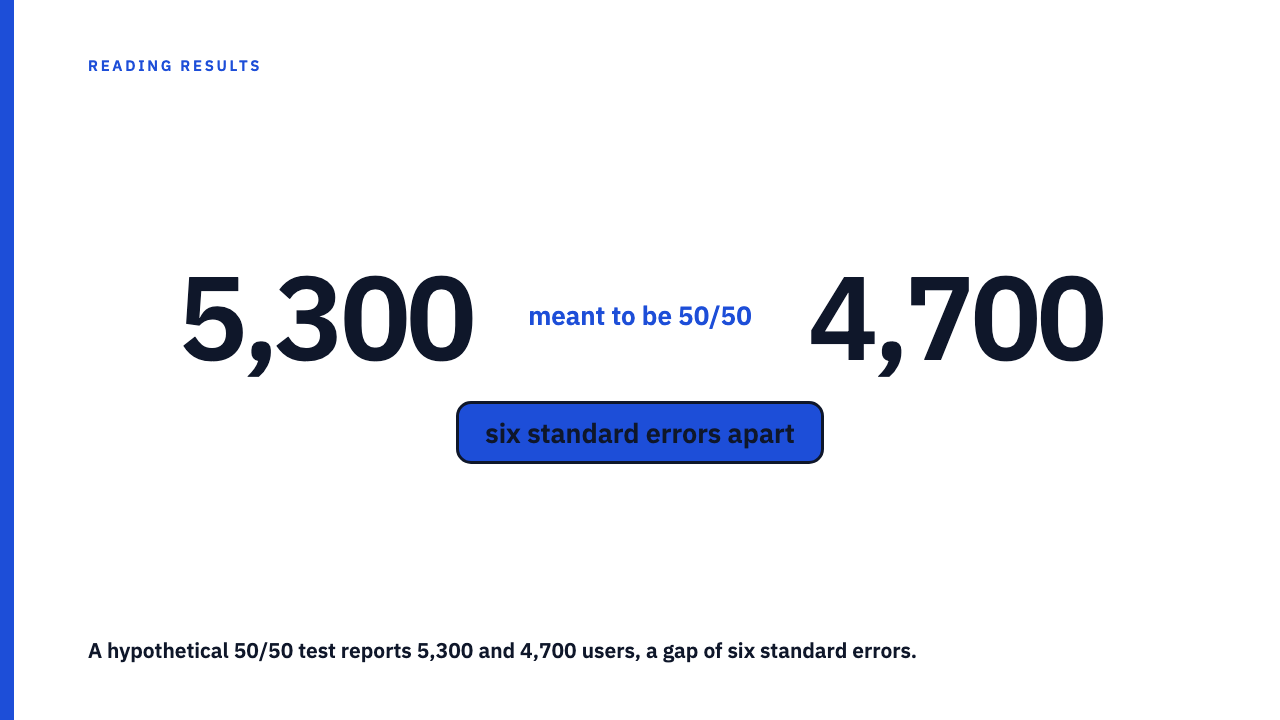
Picture a write-up (hypothetical, not a real result) saying visitors were “split evenly” between two pages, then listing 5,300 users in the variant and 4,700 in the control.
The core idea is simple. If assignment was random and the split was set to 50/50, the group sizes should land close to equal. When counts sit further from the design than chance allows, it is called a sample ratio mismatch. Wikipedia’s entry on the term describes it as a statistically significant difference between the expected and actual group sizes, and says it is detected with a chi-squared test.
This matters even when the headline p-value looks fine. A p-value is computed on the assumption that assignment worked as designed. Random assignment is meant to make the groups comparable on average, which is why a difference can be credited to the variant. If the group sizes say assignment did not work as designed, the p-value answers a question the test did not run.
How far apart is too far apart: the check you can do on a napkin
First worked example, hypothetical. The design is 50/50 with 10,000 users, so expect 5,000 per group. The standard error of a group count is the square root of (total x 0.5 x 0.5), which is 50 here. The variant has 5,300, which is 300 away: six standard errors.
Second example, hypothetical: groups of 5,060 and 4,940 are 60 away, or 1.2 standard errors. Ordinary wobble, not a flag.
As a reading heuristic: a gap of one or two standard errors is unremarkable, three or more is a flag, and six is not plausibly chance. The formal version is the chi-squared goodness of fit test, which compares observed counts with expected counts. For two groups at an even split it is the same arithmetic squared: in the first example, 18 plus 18 is 36, the square of six.
- Find the stated design (50/50, 90/10, or whatever the write-up says).
- Compute expected counts: expected share times total users.
- Compute the gap between each reported count and its expected count.
- Divide the gap by the standard error, the square root of total x share x (1 minus share).
It works for unequal designs too: for a stated 90/10 holdout of 10,000 users, expect 9,000 and 1,000, with a standard error of 30.
Small gaps in small tests, big gaps in big ones
This hypothetical table shows an identical 53/47 split in two tests.
| Hypothetical test | Total users | Group sizes | Gap from even | Standard error | Gap in standard errors |
|---|---|---|---|---|---|
| Small | 200 | 106 and 94 | 6 | 7.07 | about 0.85 |
| Large | 20,000 | 10,600 and 9,400 | 600 | 70.7 | about 8.5 |
It cuts both ways: a lopsided split in a tiny test is often chance, and a small imbalance in a huge test can be a serious flag. Do not eyeball the ratio. Compute the standard errors.
What an uneven split usually means has gone wrong
The check shows something is off, not what. A 2019 KDD paper by experimentation practitioners likens a mismatch to a fever: a symptom of several different data quality problems. General families of cause, none assumable in a given case:
- assignment that was not truly random;
- tracking that records one variant more reliably than the other, such as a slower page losing visitors before the tag fires;
- bots or filtering applied to one arm and not the other;
- users reassigned or counted twice.
If the missing or extra users are not a random slice, the two groups are no longer comparable, so the measured difference may reflect who got counted rather than what the variant did. And a clean ratio does not prove a test was sound.
What to do when you find a mismatch
- Check whether the case study explains the gap: exclusions, bot filtering, a later ramp up of one arm.
- Ask the agency or advertiser for the pre-exclusion assigned counts.
- Treat the reported lift as unconfirmed until you get an answer.
A good explanation is documented: a stated exclusion applied equally to both arms, with counts before and after. A weak one is silence, or “it evened out.” A mismatch does not prove the result wrong, only that the groups may not be comparable.
If the case study never states the intended split, the check has no baseline, and that omission is itself the finding.
Where this sits next to the other ways a test claim goes wrong
This is the cheapest check, needing two published numbers. For the wider checklist, see what a case study leaves out when it names the winning variant. On stopping, see how a test stopped early overstates the winning margin. On p-values, read statistically significant is not the same as worth doing. For another denominator, ask out of how many tested.
The honest limit: the check cannot rescue a test, only tell you how much weight to put on it. To practise, Browse the case study library, or submit your own.
FAQ
Is a 52/48 split in an A/B test always a problem?
No. At a few hundred users it is within ordinary chance, while at tens of thousands it is a flag, so compute the standard error rather than using a fixed cutoff.
Can a test with a sample ratio mismatch still be right?
It can be, but you cannot tell from the write-up. Treat the result as unconfirmed until the cause is explained.
What if the case study never says what split was intended?
Then there is no expected count to compare against. Assume an even split only tentatively, and ask about the missing design statement.
Does a significant p-value cancel out the mismatch?
No. The p-value assumes assignment worked as designed, so if it did not, it answers a question the test did not run.
Sources
- Sample ratio mismatch, fetched 2026-10-07
- Diagnosing Sample Ratio Mismatch in Online Controlled Experiments, fetched 2026-10-07
- Pearson’s chi-squared test, fetched 2026-10-07
- Randomized controlled trial, fetched 2026-10-07