Comparing Two Case Studies? Match the Baselines First
You are scrolling a case study library with two entries open in different tabs, and one says 340 percent, the other 60 percent. Before shortlisting the first and moving on, it is worth asking what those two numbers actually have in common, because on their own, not much.
Why two percentages next to each other feel like a ranking
A library format does this automatically. Entries sit side by side, each with a headline number near the top, and the eye ranks any two figures placed close together. Nothing about the page claims that, but the layout implies it anyway.
It is worth saying plainly what this library is and is not. It is a collection of separate reports, each republished with credit to the agency that produced it, not a leaderboard, and this site does not rank or endorse one entry against another. Two case studies sharing a page is a fact about how the library is organised, not a statement about which result is stronger.
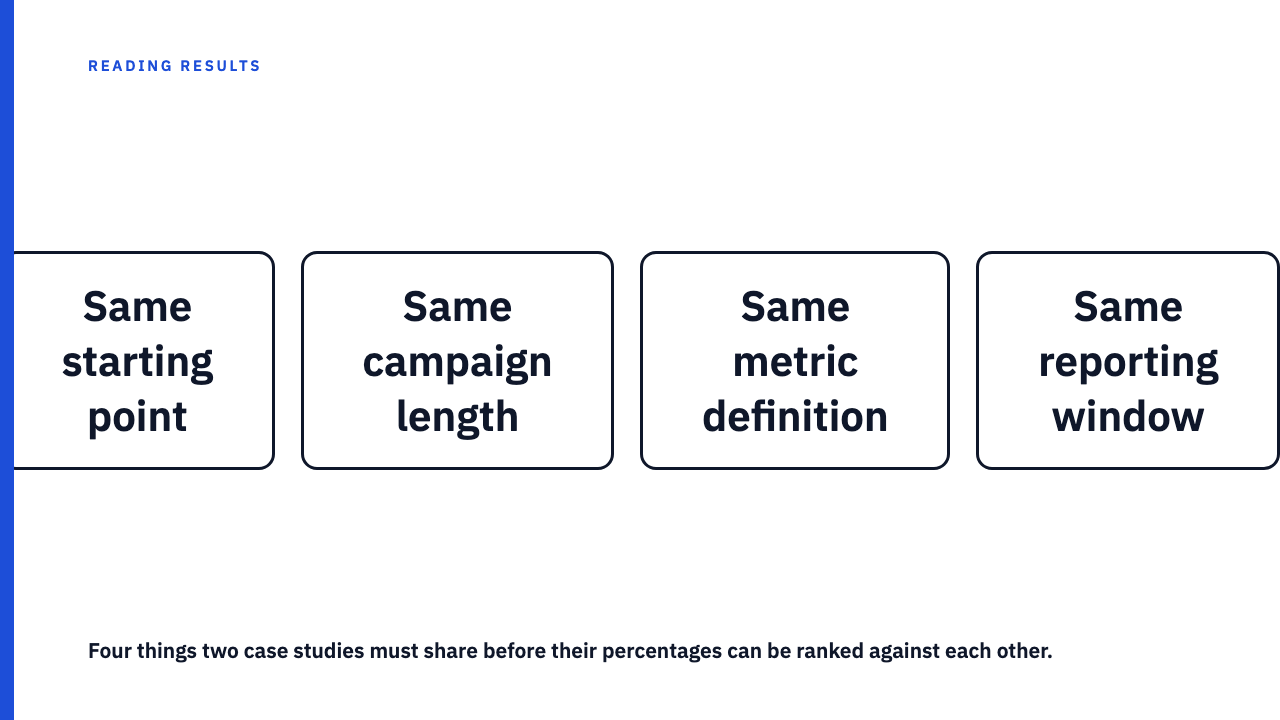
The four things that have to match before you compare
Check whether these four things are actually the same before ranking two headline numbers against each other. If any one is different or undisclosed, the comparison does not hold yet.
- Starting point (baseline). The same percentage lift means something different depending on where it started. A lift against a small, undernourished account is a different achievement than the identical percentage against an account already performing well. The percentage erases the base it was calculated from.
- Campaign length. A 40 percent lift produced in three months is not the same claim as a 40 percent lift sustained across twelve. Shorter windows are more susceptible to a single good week or a platform quirk that will not repeat.
- Metric definition. Two agencies can both report “engagement” and mean different things. One might count likes, comments and shares against impressions; another might count the same actions against a follower count that has not been updated in a year. The word is the same. The denominator is not.
- Reporting window. A headline can be pulled from the best 90 days inside a year long campaign, or it can cover the whole run, slow weeks included. A case study rarely states which one it is making unless you look for the dates.
Two case studies that agree on all four can be compared meaningfully. Two that disagree on even one cannot, no matter how confident either headline sounds. On how a single case study picks its own starting point, see the ‘before’ picture inside a single case study is also a choice.
A worked comparison with two hypothetical case studies
Picture two hypothetical case studies, invented for illustration only and not drawn from any real campaign. Call them Case Study A and Case Study B, names chosen to read as placeholders rather than brands.
Case Study A (hypothetical) reports a 300 percent increase in engagement over a six week product launch, starting from a small following in the low hundreds. Six weeks is short enough that a single strong week could carry most of the gain.
Case Study B (hypothetical) reports a 45 percent increase in engagement over an eighteen month retainer, on an account that already had a large, established following before the campaign began. Forty five percent against that base represents far more absolute movement than the number alone suggests, sustained across a year and a half rather than a single burst.
Read quickly, A looks like the stronger result. It is not, and this is not a case for declaring B the winner either. Both examples are hypothetical. A started smaller and ran shorter; B started larger and ran longer; the metric definitions have not even been confirmed to match. Ranking them would require knowing the actual account sizes, the actual engagement definitions used, and whether either number was pulled from a shorter window inside a longer campaign. When the base is small, the percentage is just noise goes further into the baseline problem, and a 90 day headline inside a 12 month campaign covers the reporting window problem.
What to do when the library doesn’t give you enough to compare
Most of the time, a published case study will not hand you all four match points cleanly. Campaign length is sometimes missing entirely, and metric definitions are rarely spelled out. Treat the two entries as separate, unranked reports rather than forcing a comparison the data cannot support; wanting to compare them does not create the information needed to do it. It also helps to remember what this library covers: a range of industries, republished as they come in, with an uneven number of entries per industry, its own reason one entry should not outrank another. An ecommerce case study and a healthcare case study were never trying to hit the same benchmark.
A practical habit while browsing: look for the four match points before shortlisting one over another. A case study missing its campaign length or metric definition is not automatically the weaker one, just harder to compare. For the fuller foundation on reading a single entry, see how to read a marketing case study without being misled, and to browse or add to the collection, browse the case study library or submit your own.
A short checklist before you rank two results
Run these four questions against any two entries. A “no” on any single question means the comparison should be dropped, not adjusted for.
- Do both disclose a comparable starting point?
- Did both campaigns run for roughly the same length of time?
- Do both agencies define the metric the same way, with the same denominator?
- Does the reported window cover the full campaign in both cases?
Failing even one of these is not a reason to adjust with an estimate. It is a reason to stop treating the two results as rankable, and to read each on its own terms instead.
FAQ
Is it ever fair to compare two case studies directly?
Yes, but only once the starting point, campaign length, metric definition, and reporting window are close enough to match. When any one is undisclosed or clearly different, treat the two as separate, unranked reports rather than force a comparison.
Why would a smaller percentage lift be the stronger result?
A lift calculated from a larger or more established baseline usually represents more absolute movement than the same percentage from a small base, and a lift held over a longer campaign is a harder thing to produce than the same number over a short burst. Neither fact is visible in the percentage by itself.
Does this site rank the case studies in its own library against each other?
No. Each entry is republished with credit to the agency that reported it, and the library’s own spread across different industries and formats is not a basis for ranking one against another.