Where the Axis Starts: How a Chart Makes Small Growth Look Big
You are reading a case study and the line on the results chart climbs like a ramp. Before you have read a single axis label, you have already decided it was a big result. That reaction is the problem, because the axis start is a drawing choice. It changes the impression a chart gives without changing one underlying value.
Our how to read a results chart before the caption post gives the ten second version of this check. This post is the slower, mechanical walk-through of one specific trick, the cropped axis, so you can do the arithmetic yourself instead of trusting your first glance.
The numbers did not change, the picture did
A chart is a promise that distance on the page matches difference in the data. A cropped axis breaks that promise quietly. Wikipedia’s entry on misleading graphs describes a truncated graph as one whose y axis does not start at 0, and says such graphs can create the impression of important change where there is relatively little.
One hypothetical chart, drawn twice
Hypothetical example, not a reported result. The figures below are invented to illustrate a construction. They are not any agency’s numbers.
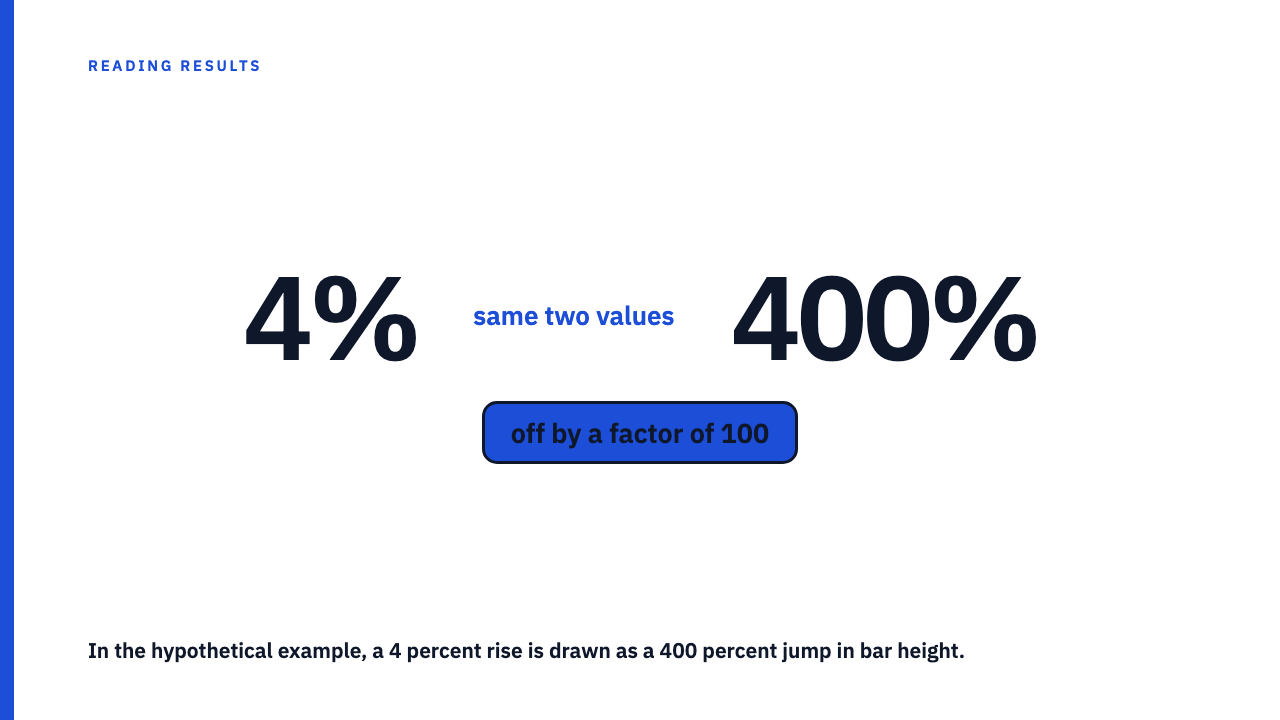
Imagine a monthly figure of 10,000 in the first month and 10,400 in the last. The actual rise is 400 on a base of 10,000, which is 4 percent.
Chart A runs the vertical axis from 9,900 to 10,500, a span of 600 units of height. The first bar reaches 100 of those 600 units (10,000 minus 9,900), about one sixth of the height. The last bar reaches 500 of 600 (10,400 minus 9,900), about five sixths. The last bar is drawn five times as tall as the first, for a 4 percent change.
Chart B plots the same two values on an axis from 0 to 11,000. The first bar fills about 91 percent of the height and the last about 95 percent. The two bars are nearly the same height, which is what a 4 percent change should look like. Nothing in the data changed between A and B. Only the axis did.
| Hypothetical chart | Axis minimum | Axis maximum | Drawn height ratio, last to first | True ratio |
|---|---|---|---|---|
| A, cropped | 9,900 | 10,500 | 5.0 to 1 | 1.04 to 1 |
| B, zero based | 0 | 11,000 | about 1.04 to 1 | 1.04 to 1 |
Back out the real change in three steps
- Read the first and last printed tick on the vertical axis. In Chart A that is 9,900 and 10,500. If there are no ticks, stop here and treat the chart as unverified.
- Read or estimate the two plotted values against those ticks. The first bar sits one sixth of the way up the axis, so about 10,000. The last sits five sixths of the way up, so about 10,400.
- Compute the change as end minus start, divided by start: 400 divided by 10,000 is 4 percent. Then compare it with how the picture looks. The bars are drawn at 5 to 1, a change of 400 percent in height, against 4 percent in the data.
That comparison gives you a drawn-versus-real ratio: the size of change the picture shows, divided by the size of change the number shows. It is the same logic behind what Edward Tufte called the lie factor, one of the key concepts listed in the Wikipedia article on his book The Visual Display of Quantitative Information.
Bars and lines are not judged the same way
Do not over-correct into “any axis that skips zero is a lie.” A bar chart encodes value in bar length. Wikipedia describes bars as having lengths proportional to the values they represent, so a bar chart whose axis does not start at zero misstates the proportion between bars outright. A line shows position and direction, so a non-zero start is sometimes defensible, but then the slope needs the axis range stated beside it.
The rule of thumb: for bars, insist on zero. For lines, insist on seeing the full axis range, then ask whether the change matters at that scale.
There is an honest counterpoint. A zero-based chart can hide a change that is real and meaningful. Picture a hypothetical conversion rate moving from 2.0 to 2.4 percent. On an axis from 0 to 100 percent that line looks flat, yet it is a 20 percent relative improvement, a change worth knowing about (see percent increase versus percentage points). The fix is knowing the size of the change, not worshipping zero.
When a cropped axis is fair, and when it is not
A cropped axis alone does not prove bad intent. Wikipedia notes that some charting software truncates by default when all values sit in a narrow range, so a cropped axis can appear without anyone choosing it.
| Reasonable | Warning sign |
|---|---|
| A line chart, not bars | Bars drawn on a cropped base |
| A metric that never plausibly nears zero | No axis labels at all, or ticks missing or in tiny type |
| Axis range clearly labelled | A headline percentage absent while the chart carries the whole claim |
| The change quoted as a number beside the chart | A cropped axis only on the flattering chart, in a document with several |
Here is the part that is judgement rather than arithmetic. A case study that makes the visual do the work the number should do has told you something about how much it trusts the number. That is a reason to ask more questions, not a verdict.
Questions to put to the chart, and to the agency
When a chart fails the check, ask for three things: the underlying values behind the chart, the exact axis range, and the percentage change over the same window.
Then run the neighbouring checks. Ask what base the percentage sits on, because when the base is small, the percentage is just noise. Ask whether the dates were chosen, because a cropped axis and a cherry-picked reporting window often travel together on the same chart.
Every number in a library entry is the agency’s own, and you should run this same axis check on any chart you find there. Browse the case study library, or submit your own.
FAQ
Does every chart axis have to start at zero?
No. Bar charts should, because bar length is the encoding. Line charts may crop, but the axis range must be visible and the size of the change should be stated as a number. Wikipedia’s misleading graph entry notes that studies found people still overestimated differences even when told the axis was truncated.
Is a truncated axis always deliberate?
Not necessarily. Some charting software scales the axis to the data range by default, so a cropped axis can appear without anyone choosing it. Your job is to check the axis and compute the change, not to assign motive.
Sources
- Misleading graph, Wikipedia, fetched 2026-10-06
- The Visual Display of Quantitative Information, Wikipedia, fetched 2026-10-06
- Bar chart, Wikipedia, fetched 2026-10-06