A Test That Found Nothing May Have Been Too Small to Find It
A comparison says short video “showed no significant difference” from static images, and the next paragraph moves on as if the question were closed. The sentence sounds like the most rigorous thing in the document, which is why it deserves a second look.
The sentence that ends a conversation
The shape is familiar: we tested it, there was no significant difference, so we dropped it. But the sentence permits two readings. Either the tactic does not help, or the test could not have seen the help if it existed. The reported wording is identical under both.
That is the whole argument in one line: a test that could not have found an effect has not shown there is none.
What “not significant” actually says
A non-significant result means the data are compatible with no effect. It does not say the data are incompatible with a real effect of useful size. Only the first statement is on the page. Absence of evidence is not evidence of absence. Statisticians call that error a Type II error, a false negative, in which a real effect is missed (Wikipedia, Type I and type II errors).
The asymmetry is built in. Significance tests are designed to stop you calling noise a win, not to prove a tactic is useless. For the other half of that story, see significance is not the same claim as a big result.
The missing idea is statistical power: the chance that a test detects an effect of a given size if that effect is real. It depends on the sample size, the size of the effect and the significance level (Wikipedia, Statistical power). For a conversion test, the sample that matters is conversions, not visitors or impressions.
A hypothetical test that found nothing
HYPOTHETICAL. Every number in this section is invented for illustration. It is not a reported result, and it belongs to no agency, platform or library entry.
Picture two variants of a landing page, 2,000 visitors each, with a baseline conversion rate of 3.0%. Variant A converts 60 visitors. Variant B converts 66, which is 3.3%. The difference is 0.3 percentage points, a 10% relative lift. A two-sided test at the 5% level gives a p-value of about 0.59. The report says “no significant difference.”
Here is what the report did not print. The 95% confidence interval on the difference runs from about minus 0.8 to plus 1.4 percentage points. That range includes zero. It includes a harm. And it includes a lift of nearly half the baseline, since plus 1.4 points on 3.0% is about 47%. The test is compatible with nothing and with a great deal.
HYPOTHETICAL result: the honest write-up is “inconclusive,” not “does not work.”
Method: normal approximation for two proportions, two-sided, 5% level, unpooled standard error for the interval.
How big a lift could that test have found?
Same hypothetical test, 2,000 per variant, 3.0% baseline: how often would it detect a real lift of each size?
| True rate in variant B | Relative lift | Chance the test detects it (power) |
|---|---|---|
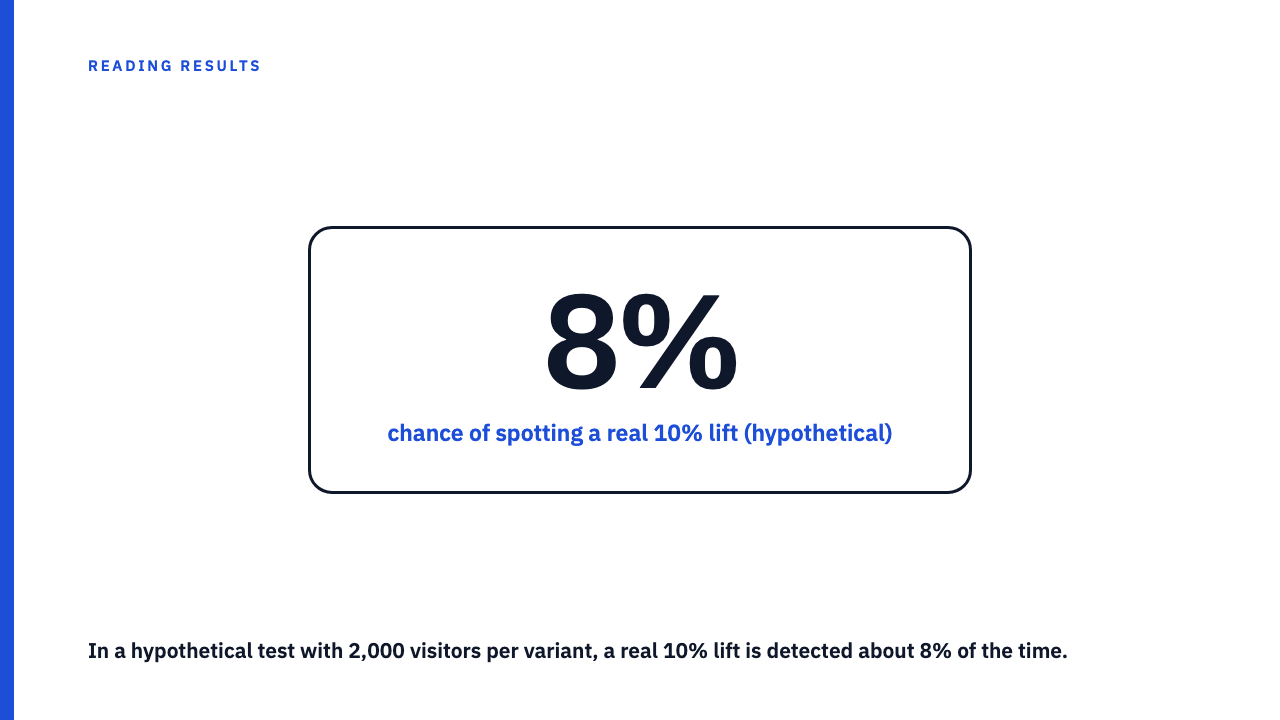
| 3.3% | +10% | about 8% |
| 3.6% | +20% | about 19% |
| 3.9% | +30% | about 35% |
| 4.2% | +40% | about 53% |
| 4.5% | +50% | about 71% |
| 4.8% | +60% | about 84% |
The reading: this test needed a true lift of roughly 1.7 points, close to 60% relative, before it would detect it four times out of five. Anything smaller would usually be missed. So “no significant difference” here rules out only enormous lifts.
The counterpart is sample size, computed for this hypothetical baseline and not a benchmark. Detecting a true 10% relative lift (3.0% to 3.3%) at 80% power takes roughly 53,000 visitors per variant, about 1,600 conversions in each arm. A 20% lift takes roughly 14,000 per variant, about 420 conversions. A lower baseline makes every row worse, because power tracks conversions.
Why case studies rarely say how big the test was
Budgets rarely buy tens of thousands of conversions per arm. Segmenting a test shrinks every cell. And a null result is often the reason a tactic was dropped, so the write-up explains a decision that was already made.
This is a different failure from a test stopped early overstates the winning margin, where a lucky positive gets locked in. It is also different from a lift that is just the metric’s normal noise, where chance is mistaken for a real effect. Here the null is honest, just too small to mean much.
The harm runs in one direction. A dismissed tactic disappears from future plans and nobody re-tests it, so the error is silent and permanent in a way a false win is not.
When a null result is good evidence
A trustworthy one has a large number of conversions per variant, an interval that stays narrow around zero, and a smallest effect the team cared about, stated before the test ran. Had the hypothetical interval been minus 0.1 to plus 0.4 points, ruling out any lift worth chasing, the same words would carry real weight.
The goal is not to distrust every null, only to know which kind you are holding.
Four questions to put to any “no significant difference”
- How many conversions did each variant get, not visitors or impressions? Under a few hundred per arm, treat the null as unreadable.
- What was the confidence interval, or failing that, both raw rates? Ask what the largest lift inside that range would be worth.
- What was the smallest effect the test was designed to detect, and was it stated before the test ran?
- Was the tactic dropped because of this test alone, and could it be re-tested with more volume?
See also what a case study leaves out when it names the winning variant.
Keep reading results with a sceptical eye
Browse the case study library to practise on published work, or submit your own.
FAQ
Does “no significant difference” mean the tactic does not work?
No. It means the test did not detect a difference. Whether that counts against the tactic depends on how large an effect the test could have detected, and the hypothetical interval from minus 0.8 to plus 1.4 points left almost everything open.
How many conversions does each variant need?
There is no universal number, because it depends on the effect you want to detect. In the hypothetical, a 20% relative lift on a 3% baseline needed roughly 14,000 visitors per variant and a 10% lift roughly 53,000. Sample-size calculations take the desired power and effect size as inputs (Wikipedia, Sample size determination).
Sources
- Wikipedia, Statistical power, fetched 2026-09-25
- Wikipedia, Type I and type II errors, fetched 2026-09-25
- Wikipedia, Sample size determination, fetched 2026-09-25