A Disclosed Sample Size Can Still Hide Who Was Surveyed
The case study in front of you does something most do not. It says how many people were surveyed. The page reads n=500, and something in you relaxes, because a number appeared where usually there is nothing. But that number answers a question you were not asking. You wanted to know whether the people who answered resemble the people the claim is about, and a sample size cannot tell you that.
A sample size answers a precision question, not a representativeness question
Increasing a sample size does one thing. It narrows the random noise around an estimate. Ask 500 people and the number you get bounces around the truth by some amount. Ask 5,000 and it bounces less. That is a real benefit, and it is a benefit about precision, not accuracy.
Bias works differently. If respondents came from a source that does not resemble the population the claim is about, adding more of them only makes the estimate precisely wrong. A sample of 5,000 pulled entirely from one skewed source is not more trustworthy than a sample of 500 drawn well. Size and bias are separate properties, and one does not fix the other. Pew Research Center’s polling primer makes nearly that point, noting that a poll padded out with inexpensive opt-in participants may gain no value from the extra size, and that the traditional margin of error does not capture every source of error in a poll. The margin of error is a statement about noise. What it misses is who got asked.
What ‘undisclosed composition’ actually hides
Start with the most consequential omission: whether respondents were existing customers or the general target audience. The two groups give different readings of the same lift, because existing customers already know the brand, so a survey of them measures reinforcement rather than reach. Next, geography. A sample drawn from one market and described in national language is not lying about its size, it is declining to say where the size came from, and variation between markets can exceed the effect being claimed.
Then there is how people got into the sample. Respondents who opted in after an invitation are self-selected, so the sample is filtered by willingness to answer, and willingness tracks how someone already feels about the brand. Pew’s methodological research hub carries a study comparing six online surveys of U.S. adults, three from probability-based panels and three from opt-in sources, reporting that average absolute error on the opt-in samples was about twice that of the probability-based panels. That gap is not a size gap. It is a recruitment gap.
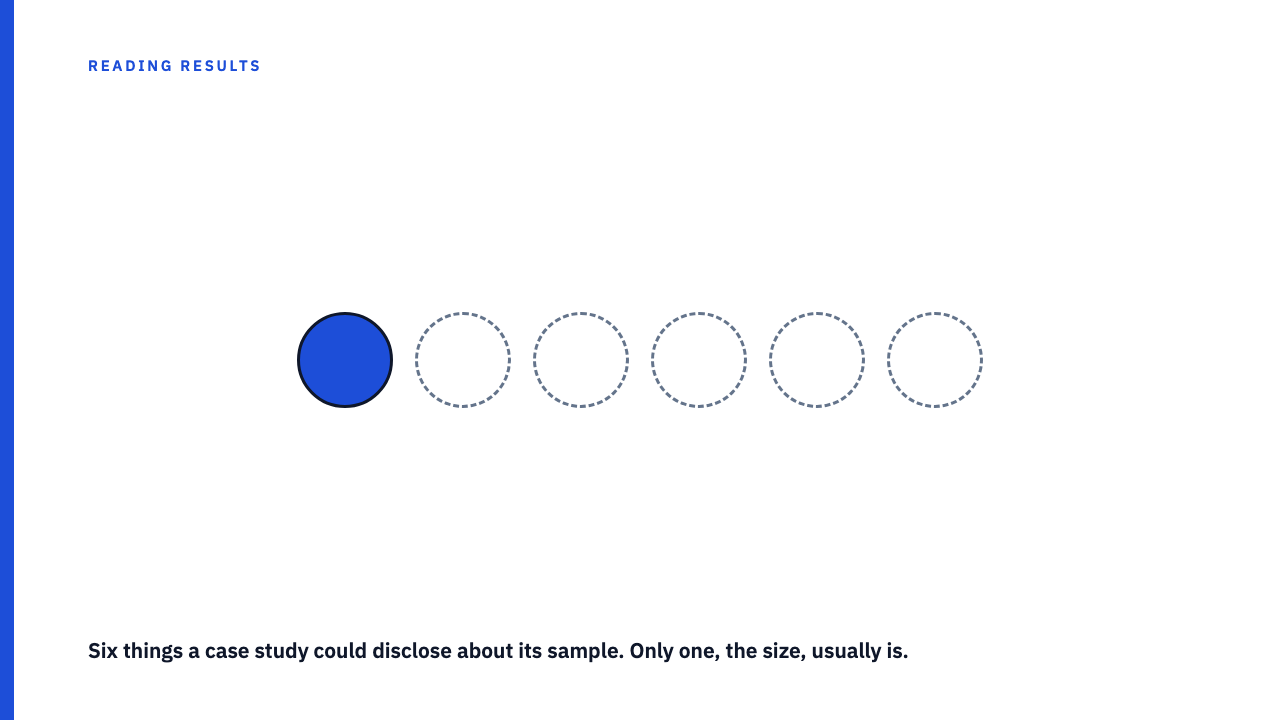
Weighting is the next silence. A weighted sample has been adjusted so its composition matches a known population on characteristics like age or education, and a case study that never mentions weighting is reporting raw counts from whoever answered. Then the response rate: 500 respondents is a numerator, and how many were invited tells you what share declined. A low rate means the 500 are the unusually willing minority of a group you never see. Each of these moves the finding while the stated sample size stays exactly the same. The one disclosed number is the one none of them touch.
A hypothetical case: the same disclosed n, two different samples
Here is a hypothetical, invented for this article and not a real reported result from any agency or brand. A hypothetical case study reports a brand awareness campaign, and a post-campaign survey of 500 respondents finds awareness twelve points higher than the pre-campaign measurement. The n is disclosed. Nothing else about the survey is described.
At face value that reads as evidence the campaign reached people who did not previously know the brand. Awareness rose, 500 people were asked, and the reader files it as reach.
Now reveal the composition of the hypothetical sample. All 500 respondents came from the brand’s existing customer email list. The twelve point figure has not changed, but what it supports has. It now says that people who had already bought from this brand, and subscribed to hear from it, reported higher awareness after a campaign pushed into their inbox. That is a real finding about reinforcement in a warm audience, and a different claim from reaching people who did not know the brand. The headline was implicitly making the second one.
This is a companion problem to the missing sample size, not a repeat of it
These two failures get collapsed together, so separate them. A case study that never says how many people were surveyed has withheld the scale of its evidence. One that states an n but never characterises the respondents has disclosed scale and withheld everything that determines what the scale measures. Both are gaps. They are not the same gap.
The risk is the reflex that says at least they gave us an n, so this generalises. Disclosing a number is the floor of a methodology disclosure, not the finish line. A study that clears the floor and stops has told you how loud its evidence is without saying what it is evidence of, which is the instinct behind a case study number is only as good as what backs it up.
What a genuine composition disclosure includes, next to what usually gets left out
| Element | What a size-only disclosure states | What is left unstated |
|---|---|---|
| Sample size | The count of respondents, for example n=500 | Nothing. This is the one element disclosed. |
| Recruitment method | Silent | Whether respondents were randomly sampled, drawn from a panel, or opted in after an invitation |
| Existing versus new customer split | Silent | What share had already bought from or followed the brand |
| Geographic or market scope | Silent, or implied by the campaign description | Which markets respondents came from, and whether one market is described in broader terms |
| Response rate | Silent | How many were invited, so how selective the responding group is |
| Weighting or adjustment | Silent | Whether responses were adjusted to match a known population, and on what |
Questions worth asking before a stated sample size counts as rigor
- Who was invited to respond, and how were they contacted?
- Were respondents existing customers, or the general target audience the campaign was meant to reach?
- Was the sample drawn from one market or several, and does the claim stay inside that scope?
- What was the response rate, and what might the group that declined look like?
- Was the sample weighted to match a known population, and on which characteristics?
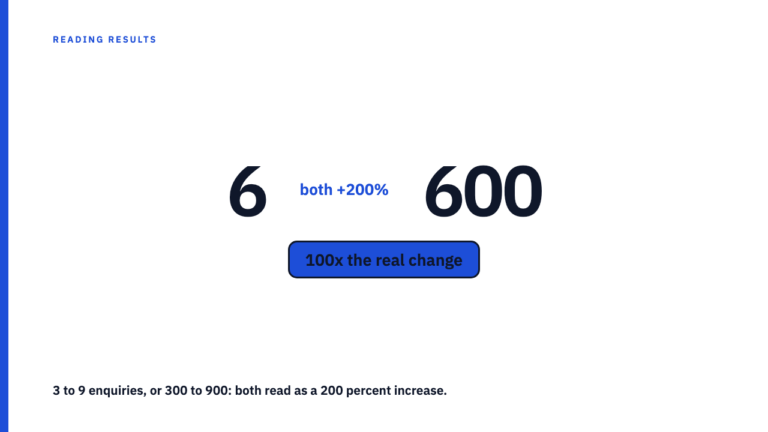
If a case study answers none of these, the honest reading is not that the survey was badly run. It is that you cannot tell, and cannot tell should lower your confidence rather than leave it untouched. The same habit applies to the base under a percentage: when the base is small, the percentage is just noise.
Read more case studies with this question in hand
Browse the case study library, each entry credited to the agency that published it, and check what each one says about where its numbers came from. If you have published research of your own, submit your own. For the wider set of checks, start with how to read a marketing case study without being misled.
FAQ
If a case study states n=500, isn’t that enough to trust the result?
No. The stated size bounds how much random noise surrounds the estimate, and that is all it does. A biased sample of 500 and a biased sample of 5,000 are equally biased, because size and representativeness are separate properties. The larger one just reports its bias more precisely.
How would a reader find out the sampling method if the case study doesn’t say?
Usually they cannot, and that is the useful part. Treat the silence as information rather than assuming good practice, and lower your confidence in the headline number to match. A result you cannot situate in a population is not a result you can carry anywhere.
Sources
- Pew Research Center, Public Opinion Polling Basics, fetched 2026-09-07
- Pew Research Center, Methodological Research, fetched 2026-09-07
- Pew Research Center, Our Methods, fetched 2026-09-07