A Dual-Axis Chart Can Make Any Two Lines Look Related
You are reading a case study with a chart that has a left axis and a right axis. Two lines climb together across the same months, and the next sentence says one metric drove the other. Before you accept it, ask who decided how steep each line would look.
The chart that makes the claim for the author
Picture a hypothetical chart. Followers sit on the left axis and sales on the right, and both lines rise from January to June, close enough to trace with one finger. Nothing here comes from a real report.
On a dual-axis chart the author sets the minimum and maximum of each axis independently. The slope each line appears to have is therefore a decision, not a measurement. This matters for results claims because the chart is usually offered as evidence that a campaign metric moved a business metric, so the picture is carrying the argument. The wider habit is in how to read a results chart before you read the caption.
Why two rising lines will always look related
Give two same-direction series their own axes, each sized to its own range, and both lines run from the bottom left corner to the top right. Here is a small invented dataset. It is hypothetical, made up for illustration, and is not from any case study.
| Month | Hypothetical follower count | Hypothetical weekly orders |
|---|---|---|
| 1 | 10,000 | 200 |
| 2 | 11,200 | 205 |
| 3 | 12,400 | 212 |
| 4 | 13,500 | 218 |
| 5 | 14,800 | 225 |
| 6 | 16,000 | 230 |
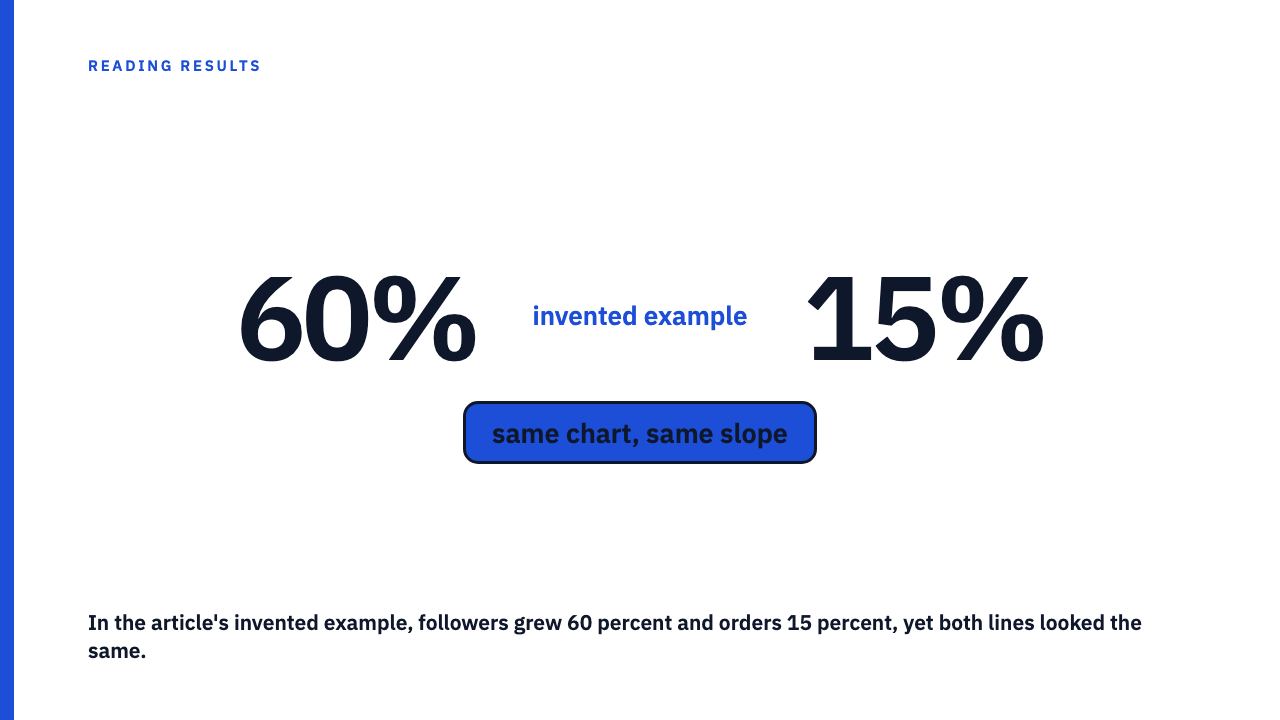
Followers grew 60 percent. Orders grew 15 percent. Yet with the left axis running 10,000 to 16,000 and the right axis 190 to 230, both lines start in one corner and finish in the other. A reader sees two lines that agree, and the 60 and the 15 have been erased by the choice of axes.
Shared direction over time is what most growing businesses show for almost any pair of metrics, so overlap tells you very little. Statisticians call an association without a causal link a spurious relationship, and trending series are a classic place for one. The missing step has its own treatment in where the missing step is when two metrics rise together, so I will not repeat it.
The swap test
The first check needs only a ruler or some imagination. Move the left series to the right axis and the right series to the left. Then change the range of one axis, for example by letting it start at zero. Finally ask whether the lines still meet and the story still reads the same.
On the hypothetical dataset, the order axis started at 190. Let it start at 0 instead. Orders of 200 to 230 now sit in a thin band near the top of a tall axis, so the orders line goes nearly flat while followers still climb. The visual link disappears and no number has changed. The rule: if a small change to an axis range changes the conclusion, the conclusion came from the axis, not the data.
Three questions to ask of any axis
- Where does each axis start? A truncated baseline is the commonest way to exaggerate a slope. The Wikipedia entry on misleading graphs notes that truncated graphs can create the impression of important change where there is relatively little.
- Are the tick intervals sensible, with the same unit steps on both sides? Gridlines may only line up because the author chose ranges that make them.
- Is there a second axis at all, and if so, why? Why was one metric not labelled on its own chart? This is a prompt to ask, not proof of bad faith.
Index both lines to 100 and look again
The honest replacement view sets both series to 100 at the start and plots them on one shared axis. On the hypothetical dataset, followers go from 10,000 to 16,000, so 16,000 divided by 10,000 times 100 gives 160. Orders go from 200 to 230, so 230 divided by 200 times 100 gives 115. Plotted together, the gap is obvious, and you can see which metric moved more without the author’s scale choice in the way.
The start point is itself a choice. Rebase both series to month 3 and the picture can shift, so check a different base month. Baseline choice is covered in the ‘before’ picture is also a choice, and what a relative series does and does not tell you is in an index chart is relative, not absolute. Indexing also does not prove cause. It only removes the scale trick.
What to do when you cannot redraw the chart
Most of the time you only have an image. Read the start and end values off each axis and compute the percentage change of each series yourself, then compare the two percentages. You can also ask the publisher for the underlying numbers, specifically the monthly values for both series.
A dual-axis chart is not automatically dishonest. Some pairs of metrics in different units are clearer with two scales. The test is whether the claim survives when the author’s scale choice is removed. Browse the case study library and try it, or submit your own.
FAQ
Is a dual-axis chart always misleading?
No. It can be legitimate when the two measures have different units and both ranges are stated clearly. But the visual overlap carries no information on its own, so the claim needs support beyond the picture.
What is the quickest way to test a dual-axis chart?
Rescale one axis in your head and see if the link holds, then compute each series’ percentage change from the end values and compare them.
What does indexing to 100 mean?
Set each series to 100 at a chosen start point and show later values relative to that, so both lines share one axis. The start point is itself a choice.
If two lines on the same axis move together, does that prove one caused the other?
No. A shared axis only removes the scale trick. Cause still needs a mechanism, as set out in the correlation-without-mechanism post.
Sources
- Misleading graph, Wikipedia, fetched 2026-10-01.
- Spurious relationship, Wikipedia, fetched 2026-10-01.