A ‘direct’ traffic spike after a social campaign: what it hides
You are reading a case study. Website traffic is up after a social campaign, and the traffic breakdown shows a large jump in a bucket called “direct”. Either the report credits social with a small slice and moves on, or it credits social with nearly the whole rise. Both can be wrong, and the headline number will not tell you which.
The claim, and the two opposite ways it goes wrong
The same direct spike supports two opposite errors. If the report ignores it, social is undercounted, because some of those visits may have come from people who saw a post. If the report claims all of it, social is overcounted, because direct also collects visits that have nothing to do with any post. Neither the report nor the reader can tell which from the headline.
Numbers in any case study belong to the agency that reported them. This post is about how to read the pattern, not about any specific report.
What the direct bucket actually contains
Direct is a fallback classification, not a measured behaviour. In Google Analytics, the help page on default channel groups describes Direct as the channel for users who arrive via a saved link or by entering your URL, and the rule that assigns it is mechanical: the source is exactly “(direct)” and the medium is “(not set)” or “(none)”. A visit lands there when the tool has no usable source information, and typing a URL is not the only way that happens.
Commonly cited contents, as possibilities and not a breakdown:
- Typed or bookmarked visits.
- Links without campaign tags.
- Private shares. Links pasted into messages or apps that may pass no referrer. This is the territory people call “dark social”, an industry term and not a category the report measures. I have not verified any single platform’s behaviour, so I assert none.
- Lost source data. Visits where the source information existed at some point and was dropped along the way.
- Cross-device journeys. Someone sees a post on a phone and visits later from a laptop. That is a plausible mechanism for a social-influenced visit to be labelled something else. It is a mechanism, not a measured share.
What tagging does and does not fix
Campaign tagging turns some would-be direct visits into labelled ones. The link owner adds parameters to the destination URL, and Google’s help page on campaign data with custom URLs lists them: utm_source names the referrer, utm_medium the marketing medium, utm_campaign the campaign. A tagged click arrives with a source and medium, so it skips the direct bucket.
A good case study says whether its links were tagged. If it does not, you cannot tell how much social traffic was visible to begin with.
Tagging has a built-in asymmetry. Tags only exist on links the agency controls. If a follower copies the plain address and sends it to a friend, that visit is untagged. They can land in direct even though the campaign caused them.
A hypothetical before and after, read both ways
HYPOTHETICAL. Picture a made-up site, one week before a campaign and one week after. Every number below is invented for illustration. Nothing here is a real result, an average or a benchmark.
Table caption: HYPOTHETICAL weekly visits by channel for an invented site. Not a real result.
| Channel | Week before | Week after | Change |
|---|---|---|---|
| Direct | 2,000 | 3,200 | +1,200 |
| Organic search | 3,000 | 3,100 | +100 |
| Social (labelled) | 500 | 800 | +300 |
| Referral | 400 | 420 | +20 |
| Total | 5,900 | 7,520 | +1,620 |
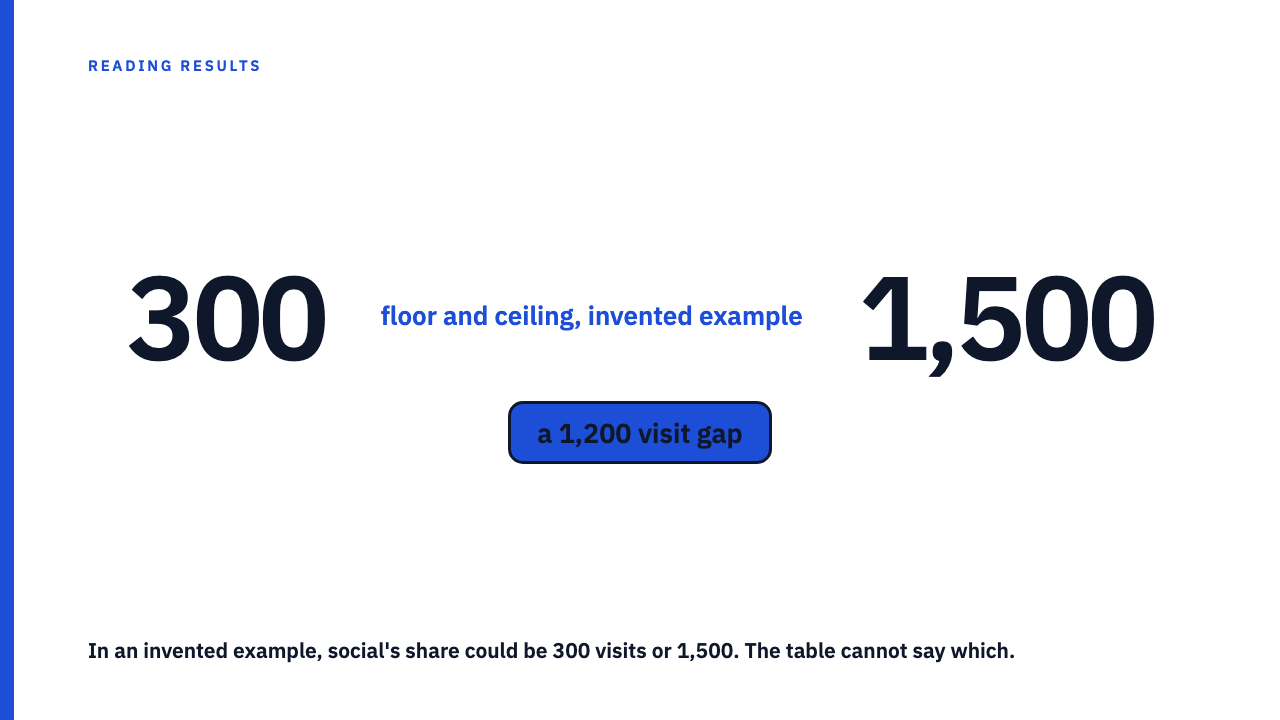
Now compute two readings. The floor is the claim “social drove only the labelled increase”: 300 visits. The ceiling is the claim “social drove the whole direct rise as well”: 300 plus 1,200, which is 1,500 visits. The gap between them is 1,200 visits.
The true figure sits somewhere in that range. The table cannot say where, because it records which label each visit received, not why it happened.
Why the spike might not be social at all
Timing is not proof. These non-social causes can raise direct traffic in the same window, and each is a question to put to the report:
- Email sends whose links carried no tags.
- Offline or press activity in the same week.
- Seasonality. We cover the same logic in seasonal tailwind.
- Word of mouth, or people searching the brand name and then typing the address.
- A change in how the analytics setup classifies traffic, which moves visits between buckets without new visitors.
The vendor also notes that source dimensions carry different scopes (user, session, event), so a report mixing “first user source” with “session source” is not comparing like with like.
The same problem appears when several things move at once. We make the point in a combined result doesn’t say which channel earned it.
Two questions that settle how to read the claim
First: did the report show the direct channel’s before and after, or only the labelled sources? A missing direct row means either the number was unremarkable or it was large and went undiscussed. Ask for it. Check also whether the attribution window is a choice that was disclosed.
Second: what ties the direct rise to the campaign beyond timing? Three kinds of evidence are worth knowing:
- A holdout comparison, where a similar audience or region was not exposed. This is the strongest, and it is the logic behind holdout tests. It can show extra traffic caused, but only for the groups compared.
- A “how did you hear about us” question after purchase. It can show what people remember, and it can surface private shares. It misses what people forgot, and anyone who did not buy.
- A lift that follows the posting schedule, with bumps on posting days and fades between. That makes the link more plausible, but does not rule out something else on the same calendar.
If none of these exists, the honest sentence is a range: “social drove at least X labelled visits and may have contributed to some of the Y increase in direct.”
Where this library stands
The library holds 10 published case studies, each credited to the agency behind it, alongside 85 blog posts on reading results like this. You can Browse the case study library, or submit your own.
FAQ
Is direct traffic people typing the URL?
Partly at most. Google’s definition describes Direct as users arriving via a saved link or by entering the URL, and its rule assigns the label when the source is “(direct)” with a medium of “(not set)” or “(none)”, so it works as a fallback for visits without source information. Untagged links, private shares and lost source data can land there too, with no sourced percentage for any of them.
What is dark social?
It is an industry term for shares that carry no referrer, such as links passed around in private messages. It is not a measured category in the analytics report, and I give no estimate of its size, because no sourced figure exists.
Sources
- Google Analytics Help: default channel group, fetched 2026-10-08 (HTTP 200).
- Google Analytics Help: campaign data with custom URLs, fetched 2026-10-08 (HTTP 200).
- Google Analytics Help: scopes of traffic-source dimensions, fetched 2026-10-08 (HTTP 200).