An LTV Number From a 90 Day Window Is a Forecast, Not a Measurement
A case study reports that a campaign lifted customer lifetime value by
some striking percentage, measured after a cohort’s first 90 days. The
number sounds finished, like something counted. It was not. Most of that
customer’s life has not happened yet, so most of the number is a guess
about it, not a record of it.
The number in the case study and the number that got reported
Lifetime value is, by definition, a claim about revenue that has not
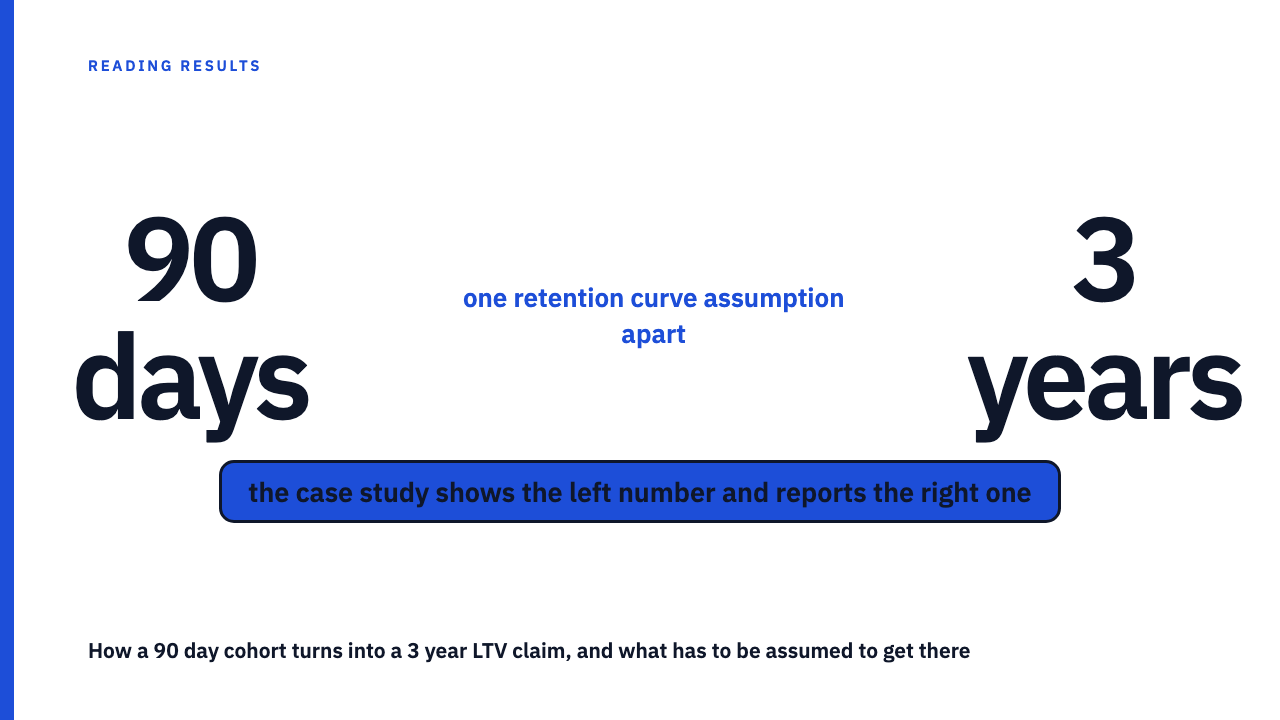
happened yet for most of the customers in the cohort it describes. A 90 day
cohort has only been observed for 90 days. Reporting a lifetime figure from
it describes something else: what those 90 days imply about years two and
three, which have not occurred.
Inside that figure are two quantities glued together. One is observed:
what those customers actually spent in the window measured. The other is
projected: everything the model assumes they will spend afterward, most of
a multi-year total by construction, since 90 days is a small fraction of
three years. A case study almost always reports the sum and calls it “LTV,”
without showing the split between what was counted and what was assumed.
What has to be assumed to turn 90 days into a lifetime
The ingredient that does this work is a retention curve, sometimes called
a churn curve: a description of what fraction of the original cohort is
still active and spending at month six, twelve, twenty four, and thirty six.
Nobody has observed that fraction for a 90 day old cohort, because it has
not lived that long. The curve is a choice about what the future probably
looks like, fitted or assumed, not a fact read off a ledger.
Different curve shapes applied to the identical 90 day starting point
produce very different lifetime totals. A curve that decays quickly month
over month describes a very different customer than one with a heavier
tail, where a smaller share keeps spending for much longer. Which shape fits
a given cohort is an empirical question the case study is rarely positioned
to have answered yet. This piece takes no position on which shape is more
common in practice, since that would itself be an unsourced claim.
A hypothetical: the same 90 days, two different 3 year numbers
The following numbers are entirely hypothetical, invented only to show
the arithmetic, and describe no real company, agency, platform, or case
study.
Picture a hypothetical cohort of 100 customers who spend a combined
$12,000 in their first 90 days, or $120 each, averaging roughly $40 per
customer per month during the window actually observed. Apply two different
hypothetical monthly retention rates to that same starting point, projecting
36 months forward at the same $40 average for whichever share of the cohort
the curve says is still active.
- Curve A assumes 95 percent of the previous month’s active spenders are
still spending each month. Projected forward, this hypothetical cohort’s per
customer lifetime value reaches approximately $674 over three years. - Curve B assumes 85 percent monthly retention, a faster decay. The
identical starting 90 days, projected under this assumption, reaches
approximately $266 per customer over three years.
That is a difference of roughly 153 percent between the two hypothetical
totals, produced entirely by the retention assumption. The 90 day input did
not change. Only the unstated model did. This illustrates the mechanism
only, is not a claim about any real company, platform, or case study, and no
real result resembling it should be treated as one.
What a case study would have to show for the LTV number to be a measurement rather than a forecast
None of this makes an early LTV figure useless. It means the figure is
conditional on a model, and a case study that wants the number treated as
more than a guess needs to disclose that model. At minimum, look for:
- The length of the actual observation window used, stated explicitly.
- The retention or churn curve used to extend the projection beyond that
window, and whether it was fitted to this cohort’s own early behaviour or
borrowed from elsewhere. - Whether the headline figure is the observed portion, the projected
portion, or a blend of both, and in what proportion. - Whether the model has been checked against an earlier cohort that has
since aged past its own projection horizon.
A case study that answers all four has moved from an assumption dressed
as a result toward something closer to a verified forecast. One that answers
none of them is asking the reader to trust the model sight unseen.
Why the projection gets reported as if it already happened
“LTV increased 40 percent” reads as a completed fact. The more accurate
version, something like “our model now projects a 40 percent higher
lifetime value under the same retention assumptions as before,” reads as a
hedge. In the editing pass that turns a results memo into a case study, the
confident sentence survives, because it is shorter and it is the one a
reader remembers.
This is worth separating from dishonesty. The underlying model can be
reasonable and may well be disclosed internally, in a methodology appendix
nobody outside the team reads. The failure in the published version is not
that the number was fabricated. It is that the case study collapses tense: a
statement about what is expected to happen gets written as a statement about
what already happened, and the reader cannot tell the two apart.
The question that surfaces this in thirty seconds
One question does most of the work: over what actual observation window
was spend measured, and what happens to this number if the retention curve
is wrong by 20 percent? The first half asks for the missing fact. The
second tests how much the headline number depends on an assumption nobody
stated.
A case study that can answer both, even approximately, is reporting
something closer to a forecast with a stated basis. One that cannot or will
not answer the observation window part is reporting a projection dressed as
a result, and should be read that way until shown otherwise.
Go deeper
For the broader framework, see
how to read a marketing case study.
The same undisclosed-choice pattern appears in
the attribution window is a choice
and in
the counterfactual a case study can’t show you.
You can also
browse the case study library
or
submit your own.
FAQ
Can LTV ever be a fully measured number rather than a projection?
Only for a cohort whose entire relevant lifespan has already elapsed and
been observed in full, which is rare to report because by then the number
is old news. For any cohort still active, which is most of the ones in case
studies, LTV is necessarily partly or wholly projected.
Does a short observation window make an LTV claim worthless?
No. It means the number is a forecast conditional on a stated model,
useful if the model and window are disclosed. The failure is presenting it
as a completed measurement with no model named at all.