
The attribution window is a choice, and it is rarely disclosed
Two case studies can show different returns from the same clicks, because the attribution window, a setting picked after the campaign, decided what counted.
How to interpret social media results and the numbers behind them
Two case studies can show different returns from the same clicks, because the attribution window, a setting picked after the campaign, decided what counted.
A rising cumulative total can climb every single month even as the underlying rate slows down. Here is the one question that tells the two claims apart.
A truncated axis, a cumulative total, and a mismatched dual axis account for most misleading case study charts, and each one is spotted in about ten seconds.
A single standout post can carry a case study’s whole headline number. Here is how to tell a repeatable strategy from a one post outlier before believing it.
A strong result reported during a known seasonal spike is not proof the campaign caused it. One question separates a real effect from a holiday tailwind.
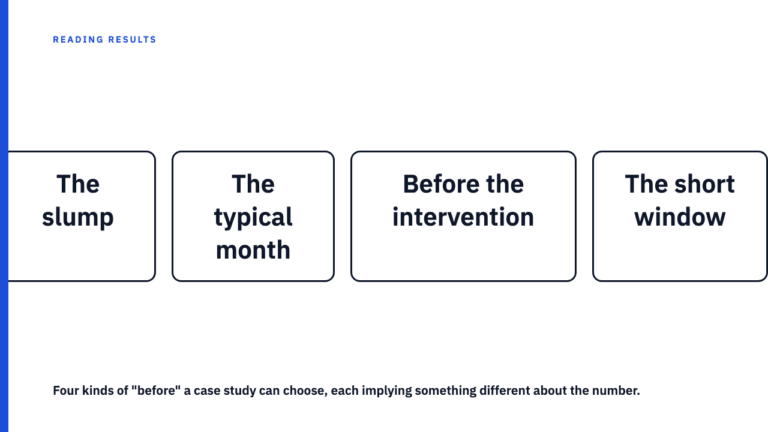
A case study’s before period is picked, not given. Learn what to ask about the comparison window before you trust the percentage.
A published case study number is honest, but it belongs to one company’s size, budget, and starting point. Here is what has to match before you copy it.
Track twenty metrics on one dashboard and one will move by chance alone. Learn to tell a predicted result from the one a dashboard happened to produce.
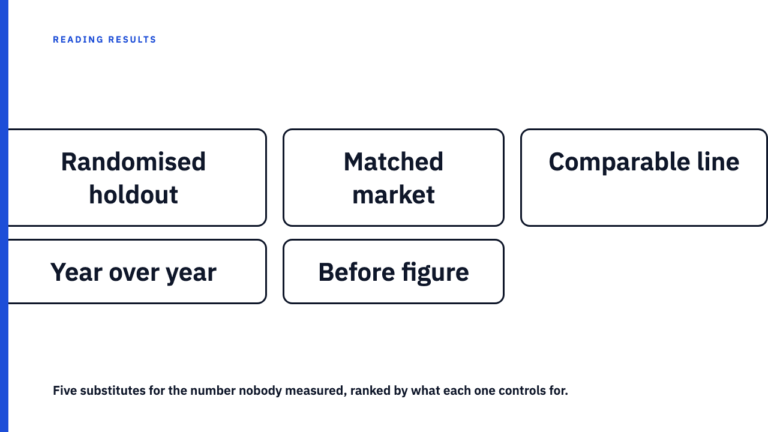
Every results claim compares the period against what would have happened anyway, a number nobody measured. Grade the substitute the report offers instead.
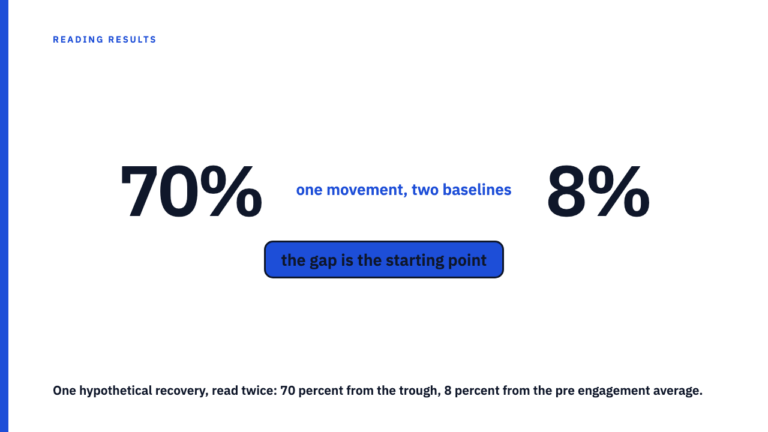
Agencies are usually hired at a low point, and low points partly correct on their own. Learn which share of a reported lift is arithmetic, and how to test it.