
How Old Is the Youngest Cohort Behind That Result?
Conversions and refunds arrive late. Learn to spot a case study number cut off before its cohort matured, and what to ask the agency to see the final figure.
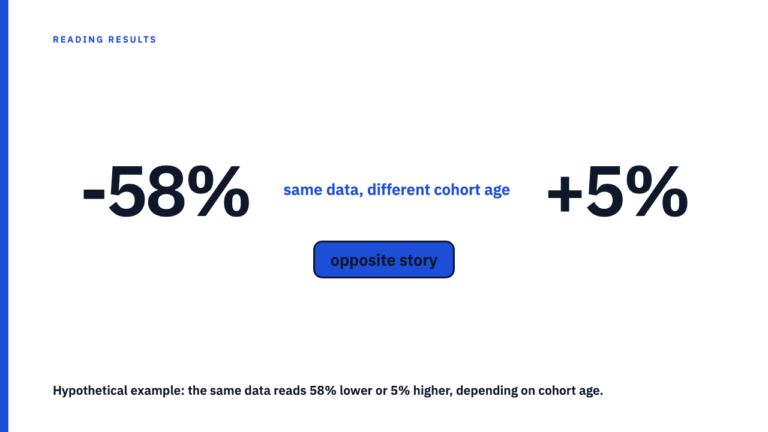
Conversions and refunds arrive late. Learn to spot a case study number cut off before its cohort matured, and what to ask the agency to see the final figure.
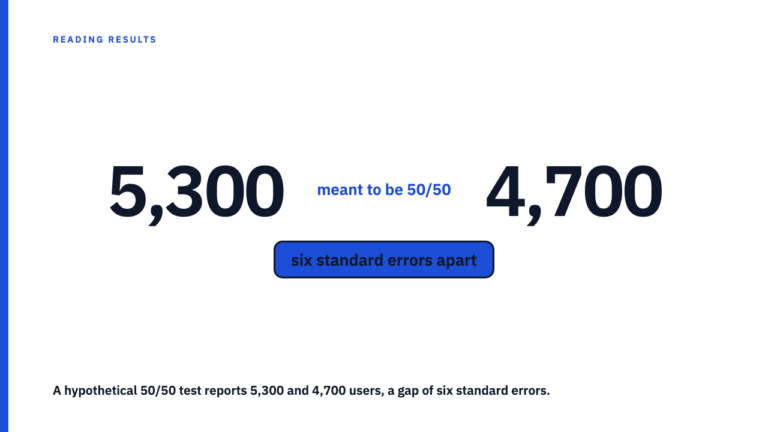
When a test meant to be 50/50 reports very uneven groups, the result may be compromised. Here is the arithmetic check you can run from published counts.
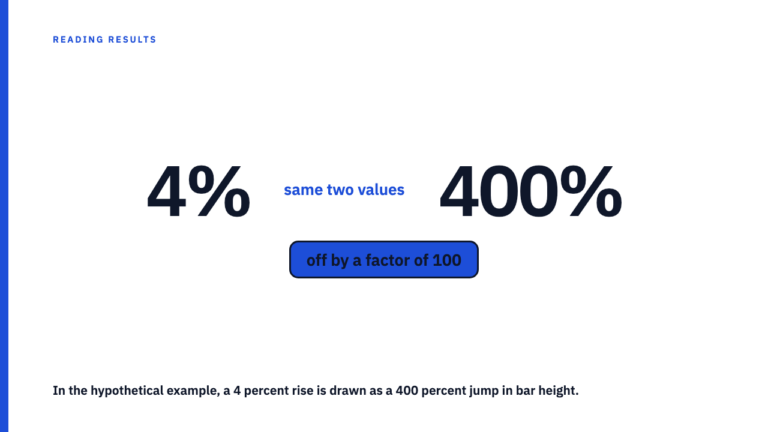
A results chart whose axis starts above zero can make a small change look huge. See a hypothetical example, when it is fair, and how to read the real change.
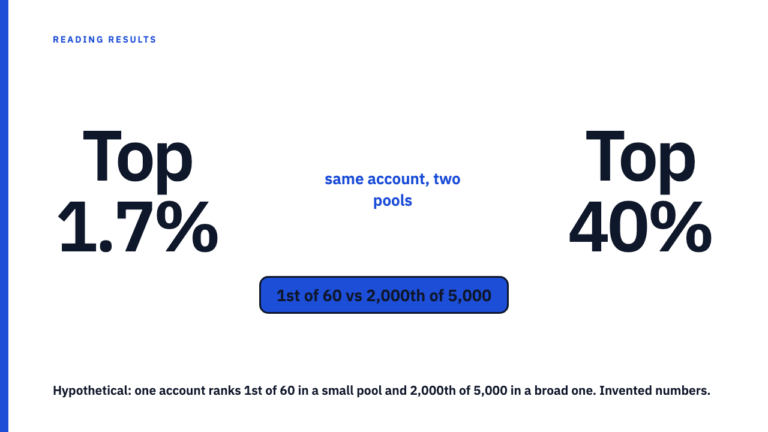
A case study says top 1 percent or number one in its category. Three questions, pool, metric and period, show whether the ranking means anything at all.
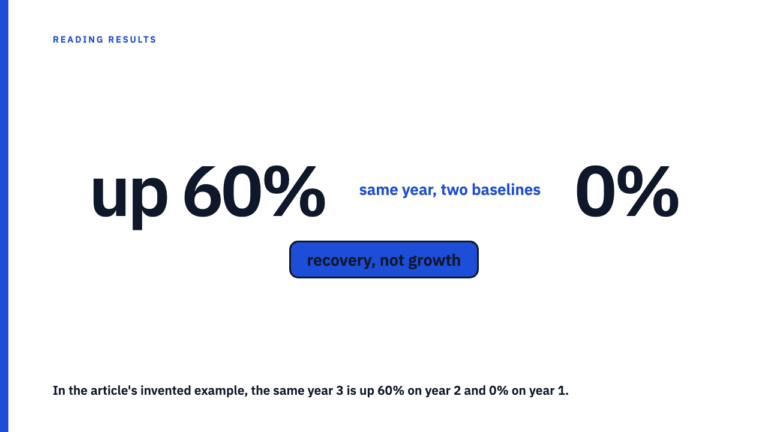
A year-over-year gain is only as good as the year it beats. Learn to test the comparison year against a second reference year before you trust the percentage.
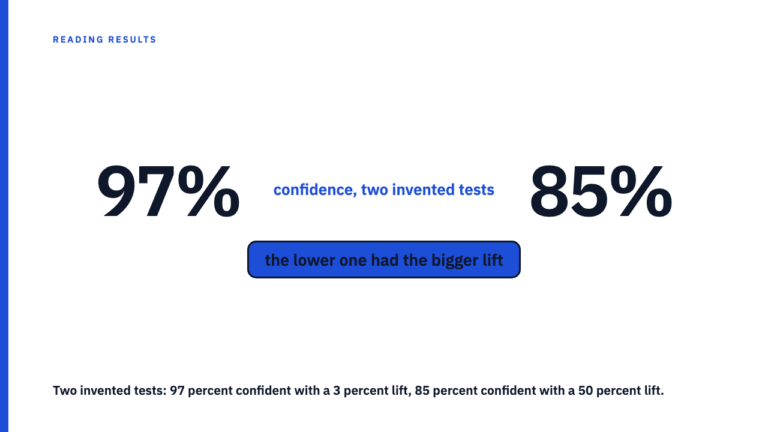
A case study says its winning variant was 97 percent confident. Here is what that figure actually measures, what it leaves out, and the questions to ask next.
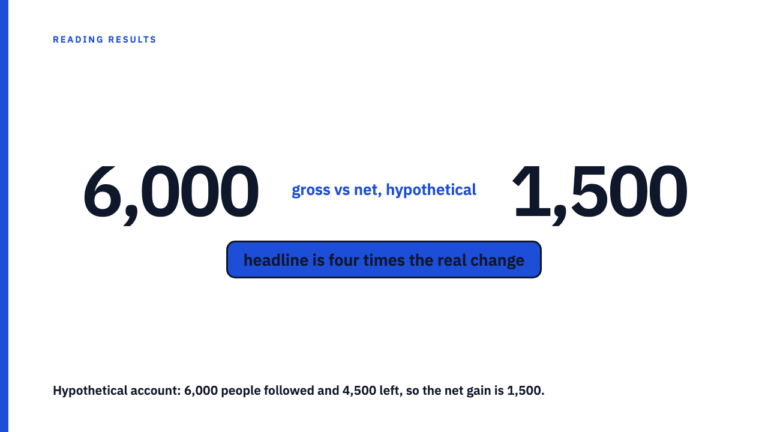
A ‘gained X new followers’ headline can hide the people who left. Learn the difference between gross gain, net gain and ending count, and what to ask for.
A code count measures redemptions, not influence. See what it overstates, how codes leak beyond a campaign, and the one question that exposes the gap.
Self-reported and platform attribution answer different questions. Here is what each one sees, misses and inflates, and how to read both in a case study.
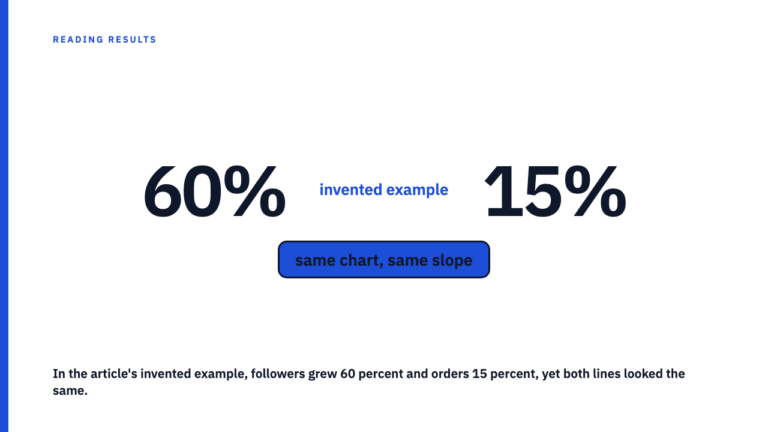
Two rising lines on separate y-axes will track each other, because the author picks both scales. Here is the swap test and indexed-axis check that expose it.