Five questions to ask before you finish a case study
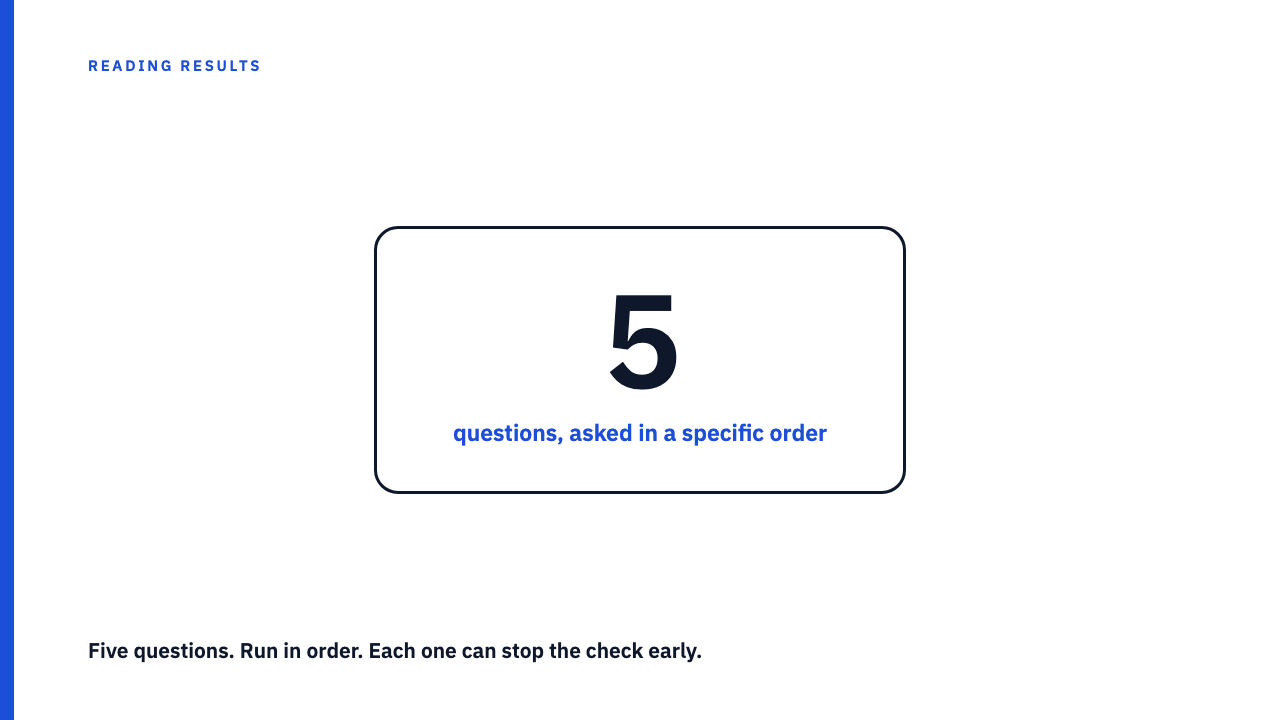
You have about two minutes before you move to the next tab, and the case study in front of you has a headline number, a client logo, and an encouraging chart. The question is not whether the number is fake, it is whether the number means what the headline implies. Five questions, in order, get you an answer before the two minutes are up.
Why order matters more than the list itself
None of the five questions below are new content. This site has already covered baseline choice, self-reported numbers, attribution windows, and small sample sizes in depth elsewhere. This piece assembles no new evidence, only a sequence, because checking all five with equal weight wastes the two minutes you have.
A concrete case: if question 1, whether the case study states a duration and a baseline, comes back empty, questions 3 through 5 cannot be evaluated at all. There is no starting point to attribute a window to, and no denominator to judge. Asking those first burns the two minutes on arithmetic with nothing underneath it.
Question 1: does it say how long, and compared to what?
A percentage or multiplier alone tells you almost nothing without a stated time window and a stated starting point. That is why this one is the gate, not just another item on the list. A hypothetical case study: “inquiries up 340 percent since working with us,” no start date, no end date, no inquiry count named beforehand. That sentence cannot be checked, because there is no “before” and no “how long” attached to the “after.” The honest version states both, even with a rounded starting figure.
The mechanism behind choosing a starting point without technically lying is in the ‘before’ picture is also a choice.
Question 2: is the headline number the goal, or just the number that looked best?
A campaign dashboard tracks several metrics at once: likes, reach, click through rate, conversions. A case study rarely shows the dashboard, only the metric that moved most, promoted to the headline. The honest version states what the campaign was hired to move before showing the number. If the brief was reach and the headline is a conversion figure, the case study answers a question nobody asked.
Question 3: whose number is it, and can it be checked against anything outside the agency’s own dashboard?
This library’s rule: every number belongs to the agency that reported it, never restated as an industry benchmark and never as this site’s own claim. Some numbers are checkable by a third party, a public follower count, a press mention. Others exist only inside the agency’s own dashboard, and leaning entirely on that kind asks for more trust than a checkable one does.
The fuller mechanism is in a number is only as good as what backs it up.
Question 4: is the attribution window doing the work the headline implies?
An attribution window, last click, seven day, twenty eight day, or view through, is a setting the agency chose, not a fact about the campaign. A hypothetical example: the same month-long campaign credits 40 conversions on a seven day window and 95 on a twenty eight day window that also counts view through activity. Only the ruler changed. Reporting the larger number without naming the window lets the reader assume a narrower measurement than the one used.
The full explanation is in the attribution window is a choice.
Question 5: is the base number big enough for the percentage to mean anything?
A percentage with no visible denominator is a shape, not a number. One built on a small denominator, roughly a few dozen or fewer, can swing enormously from a single data point. A hypothetical worked example: a small local client goes from 2 sales in a month to 5 the next, a real result, and also, mechanically, a 150 percent increase. The same 150 percent applied to a client doing 2,000 sales a month would mean 3,000 additional sales, an entirely different scale of claim.
The full mechanism is in when the base is small, the percentage is just noise.
Running all five in under two minutes
- Does it state a duration and a baseline? If not, stop, the rest cannot be evaluated.
- Is the headline number the metric the campaign was hired to move, or just the one that looked best?
- Whose number is it, and is any part checkable outside the agency’s own dashboard?
- Is the attribution window named, and would a different window have produced a different headline?
- Is the denominator stated, and large enough that one data point could not swing it this far?
Failing question 1 or 3 is disqualifying, without a baseline there is nothing to measure. Failing question 4 or 5 downgrades confidence rather than killing the claim outright.
What this checklist does not replace
A case study that passes all five has earned numbers coherent enough to take seriously as a reported result. That is not a judgment on whether the underlying creative work was good, and not a recommendation to hire the agency. For the mechanism behind any single question, see the ‘before’ picture is also a choice and a number is only as good as what backs it up, or the fuller explainer on reading a case study this checklist assembles from.
Ready to run this on a real one? Browse the case study library, or if you have a campaign worth writing up honestly, submit your own.
FAQ
Is this checklist a replacement for reading the full case study?
No. It is a fast triage pass to tell you whether a case study is worth reading closely, or whether it already fails on the gating questions.
What if a case study passes all five questions?
It means the numbers are coherent enough to take seriously as a reported result, not a judgment of the underlying creative work, and not a recommendation to hire the agency; those are separate questions covered on this site’s sister properties.
Sources
- The ‘Before’ Picture in a Case Study Is Also a Choice, fetched 2026-09-09, HTTP 200.
- A case study number is only as good as what backs it up, fetched 2026-09-09, HTTP 200.
- The attribution window is a choice, and it is rarely disclosed, fetched 2026-09-09, HTTP 200.
- When the Base Is Small, the Percentage Is Just Noise, fetched 2026-09-09, HTTP 200.
- How to Read a Marketing Case Study Without Being Misled, fetched 2026-09-09, HTTP 200.