Two 20 Percent Gains Compound, They Do Not Add to 40
A campaign report gives you a 20 percent lift at the top of the funnel, a 20 percent lift at checkout, and a headline calling that a 40 percent improvement. Both stage numbers can be accurate and the total still wrong, for a reason that has nothing to do with honesty.
What the case study actually reported
A multi-stage campaign is reported stage by stage, each stage carrying its own percentage change against its own starting point. Then those percentages are added into one headline total.
The instinct is reasonable. On the page a percentage looks like a plain number, and 20 apples plus 20 apples gives 40 apples. But a percentage is not a countable unit. It is a ratio applied to a base, and across a sequence of stages that base moves. The second 20 percent is 20 percent of something the first one already changed.
Why percentages do not stack like whole numbers
A stage that gains 20 percent multiplies whatever came into it by 1.2. If a second stage also gains 20 percent, it multiplies again by 1.2. It does not add 0.2 to anything. Two multiplications in a row are not two additions, and the gap is the error.
In words: the combined growth factor equals one plus the first rate, multiplied by one plus the second rate, and the combined percentage change is that product minus 1.
The hypothetical two-stage example, both ways
Picture a hypothetical two-stage funnel. Every figure here is invented and belongs to no real campaign and no real agency. Stage one, ad click to landing page, is reported as a 20 percent gain. Stage two, landing page to checkout, as another 20 percent gain.
| Method | Working | Stated total |
|---|---|---|
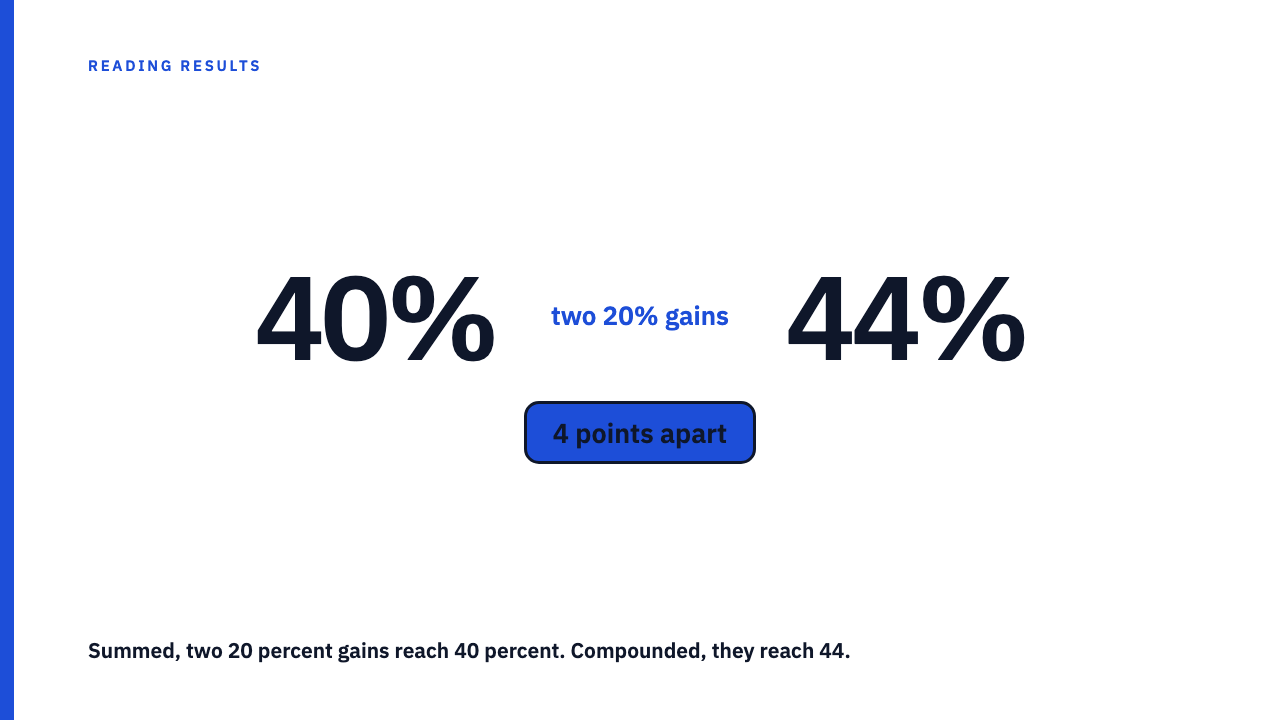
| Summed (hypothetical) | 20 + 20 | 40 percent |
| Compounded (hypothetical) | (1.2 × 1.2) minus 1 = 0.44 | 44 percent |
The compounded total is the larger of the two, by exactly four percentage points. Rounding 44 back to a cleaner 40 throws away a real part of the result. In this hypothetical, summing understated the campaign’s own outcome.
The error does not always point the same way
Summing does not reliably inflate a headline. Run the same arithmetic on declines and it goes the other way. Say a metric falls 20 percent in one period and 20 percent again in the next. Summed, that reads as a 40 percent drop. Compounded, 0.8 multiplied by 0.8 is 0.64, a 36 percent decline. Summing the losses makes the fall look four points worse than it was.
A third hypothetical breaks the intuition harder. A number gains 50 percent, then loses 50 percent. Treated as signed percentages that add, the two cancel out. They do not. The factors are 1.5 and 0.5, and 1.5 multiplied by 0.5 is 0.75, so the metric ends 25 percent below where it began. The loss came off a bigger base than the gain was added to.
The direction of the error follows the signs of the changes. You cannot look at a stacked total and know whether it is too high or too low without recomputing it.
How to recompute a stacked percentage claim
- Convert each reported change to a growth factor. Add 1 to the rate. A 20 percent gain becomes 1.2, a 15 percent decline becomes 0.85.
- Multiply the growth factors together in the order the stages occurred.
- Subtract 1 and convert back to a percentage. A product of 1.44 is a 44 percent gain, and 0.64 is a 36 percent decline.
For two stages the order of multiplication does not change the answer: 1.2 times 0.85 and 0.85 times 1.2 both give 1.02. That makes this a different species of problem from the ones that turn on sequencing and disclosure, such as which attribution window was chosen or which period was picked as the before.
What this does and does not prove
A summed total is not, on its own, evidence that a case study is dishonest. Adding percentages is an easy step to take without thinking about it, and taking it does not require any intent to mislead. A reader who accepts the summed number is trusting the wrong math either way.
Keep this separate from two neighbours. Mixing up percentage points with a percent increase is a different error, because percentage points and a percent increase are not the same claim, and that confusion is about what one figure measures rather than about combining several. A percentage built on a tiny denominator is different again, a question about whether one number is reliable at all, which bites hardest when the base itself is small.
Check it against the library
Browse the case study library and recompute any multi-stage report you find, or submit your own. For the wider framework, start with how to read a case study’s numbers in general.
FAQ
If a case study reports a 20 percent gain in one stage and a 20 percent gain in the next, what is the real combined gain?
Convert both to growth factors and multiply. Each gain is a factor of 1.2, and 1.2 multiplied by 1.2 is 1.44, so the combined change is a 44 percent gain, not 40.
Does adding sequential percentages always make the headline number look bigger than it really is?
No. For two sequential gains, summing gives a smaller number than the compounded total. For two sequential declines it overstates the drop. The direction follows the signs, so recompute.
Is a case study lying if it just adds the percentages instead of compounding them?
Not necessarily. Adding is an arithmetic habit rather than a deliberate inflation, and it needs no intent to mislead. The reader still ends up trusting a number the stages did not produce, so the correction is the same either way.
What is the difference between this and confusing percentage points with a percent increase?
That one is about what a single figure measures, whether a change is expressed in points or as a relative increase, and the site covers it in percentage points and a percent increase are not the same claim. This one is about combining two separately reported changes.
Sources
- 100 Percent Better and One Point Better Can Be the Same Result, fetched 2026-09-07.
- When the Base Is Small, the Percentage Is Just Noise, fetched 2026-09-07.
- How to Read a Marketing Case Study Without Being Misled, fetched 2026-09-07.
- The attribution window is a choice, and it is rarely disclosed, fetched 2026-09-07.
- The ‘Before’ Picture in a Case Study Is Also a Choice, fetched 2026-09-07.