Response rate matters as much as sample size
You are reading a case study and it says the result is “based on a survey of 1,200 customers.” That number feels like proof. It is large and specific and it sits under a claim you want to believe. But 1,200 tells you how many people answered, not who they are or how many were asked and stayed silent. The figure that would answer that, the response rate, is almost never printed next to the sample size. This is about spotting when it is missing.
The number that gets reported, and the one that does not
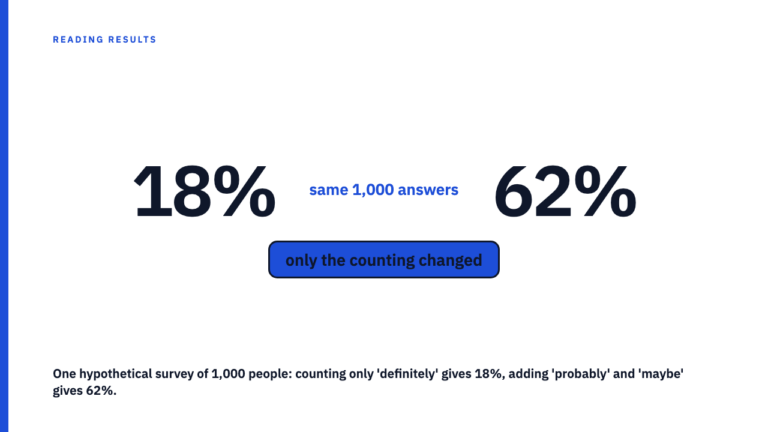
Two different measurements hide inside a survey-backed claim, and case studies routinely disclose only one. Sample size is the count of completed responses: 1,200 people finished the survey. Response rate is that count divided by the number of people invited or contacted. Email 3,000 and get 1,200 back and the rate is 40 percent. Email 60,000 and get 1,200 back and it is 2 percent. Same sample size, very different response rate.
A case study can state one without the other, and in practice it almost always states the sample size and stays quiet on the rate. That is not a small omission. The sample size tells you how many people answered; the response rate tells you who is likely missing.
Why a low response rate changes who is in the sample
The instinct is to treat a low response rate as merely a smaller survey, as if 1,200 out of 60,000 is a noisier version of 1,200 out of 3,000. It is not, because non-response is rarely random. The people who choose to answer tend to differ systematically from those who ignore the request. Strong opinions pull a response out of someone, and so does existing loyalty or an incentive attached to finishing the form. Each makes certain groups far more likely to reply, and those groups are not a cross-section of everyone asked.
So a low response rate does not just shrink the sample, it skews it toward the self-selected. A satisfaction survey that only the enthusiastic and the furious complete is measuring the enthusiastic and the furious, not the customer base. The name for this is non-response bias, sometimes called self-selection: a sample becomes non-representative because respondents disproportionately share traits that shape the outcome.
A worked example, with hypothetical numbers
Picture an agency that reports surveying 1,200 satisfied customers. Every number that follows is hypothetical, invented only to show the mechanism.
In hypothetical case A, the agency invited 3,000 customers and 1,200 replied, a hypothetical response rate of 40 percent. The group that answered is a large fraction of the whole, so there is a reasonable chance it resembles the customer base.
In hypothetical case B, the agency emailed 60,000 customers and, again, 1,200 replied, a hypothetical response rate of 2 percent. The headline is identical, 1,200 responses, but here those 1,200 are the most engaged 2 percent of the list. Reading their answers as the voice of all 60,000 is exactly the error the sample size was covering for. None of these numbers is a real reported result from any agency; they exist only to show the same reported count sitting on two completely different claims.
What a healthy disclosure looks like
Knowing the shape of an honest disclosure makes its absence obvious. A complete one names four things:
- how many people were invited or contacted,
- how many responded,
- the response rate that follows from those two numbers,
- and how the sample was recruited, whether a defined customer list, a random draw, or an open link.
What the list leaves out is a magic threshold. There is no single universal number that separates a good response rate from a bad one; it depends on the method, the population, and the recruitment, and a low rate does not automatically ruin a survey. The point is disclosure, not a cutoff. One distinction sits underneath it: a survey sent to a defined invited population has a denominator, so a rate can be computed, while an open opt-in link has no fixed invited population and therefore no computable rate. The people who showed up are volunteers by definition.
The question to ask before you trust the read
All of this collapses into a single practical move. When a case study leans on a survey, ask: out of how many people asked, and how were those people chosen. That is the question the sample size makes you forget.
If the answer is a defined list with a stated response rate, you can weigh it. If it is unavailable, or the survey turns out to have been an open link, then the responses describe volunteers, not the population. So the next time you read “based on a survey of 1,200 customers,” you know the follow-up that matters is the one left off the page.
Read the rest of the library
Response rate is one specific check inside the larger discipline of reading a marketing case study without being misled, and a concrete instance of the truth that a number is only as good as what backs it up. Since non-response is itself a selection effect, it ties to the theme that every selected sample leaves something out. You can browse the case study library, and if you have a survey-backed result, submit your own.
FAQ
Is a large sample size enough to trust a survey?
No. Size and representativeness are different properties. A large sample answers how many people responded, not whether those people resemble the population the survey claims to describe. A large but self-selected sample can mislead more than a small representative one, because its size lends it a false authority. The sample size only reassures once you also know the response rate and how the people were recruited.
What counts as a good response rate?
There is no universal cutoff, and treating a specific percentage as a settled benchmark is a mistake. What is acceptable depends on the method, the population, and how respondents were recruited, and a low rate does not automatically wreck a survey. The honest answer is disclosure: state the rate and the recruitment method and let the reader judge.
Sources
- Response rate (survey), Wikipedia, the definition of response rate as respondents divided by the sample. Fetched 2026-09-15.
- Non-response bias, Wikipedia, on how respondents can differ systematically from non-respondents. Fetched 2026-09-15.
- Participation bias, Wikipedia, on self-selection and voluntary participation. Fetched 2026-09-15.
- Pew Research Center, response rates in telephone surveys have resumed their decline, documenting falling survey response rates. Fetched 2026-09-15.