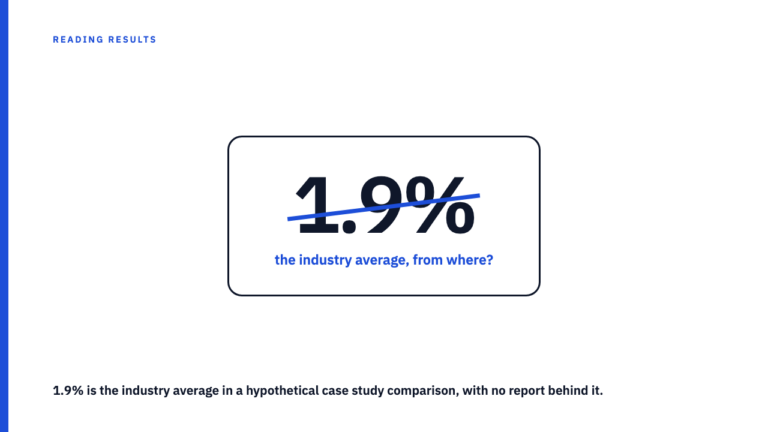
A Metric Invented for One Case Study Can’t Be Benchmarked
The headline number is attached to a metric you have never seen. A Brand Favorability Index of 74. A Quality Engagement Score of 6.2. It reads like something with a settled definition sitting off the page. Before comparing it to anything, find out whether that definition exists.
The name sounds like a category, not a coinage
A bespoke metric is a name that appears in no platform’s own analytics glossary or help documentation, and that is defined, if at all, only inside the single document reporting it. That is the whole test: not whether the name sounds technical, only whether a definition exists somewhere you can read it.
This is easy to miss because standard metrics are also confusing. Take engagement rate, which at least has a name you can search. Reporters divide by followers, by reach, or by impressions, so one campaign yields three rates. That is a definition problem, not a definition vacuum. You can ask which was used and get a checkable answer. With a coined score there is one definition, it lives in the document, and if the document is silent, nothing can be checked.
A three-step check for any unfamiliar metric name
Under a minute, and it classifies the name before you trust the number.
- Search the exact term in quotation marks, plus “definition” or “formula.” You are checking whether anyone outside the publishing agency, or one affiliated with it, uses the term as though it means something specific. If every result traces back to the same source, that is a coinage.
- Check the analytics documentation of the specific platform the campaign ran on. Not “social media” generally. Pinterest’s business help page defines engagements, engagement rate, impressions, saves, save rate, pin clicks and outbound clicks. YouTube’s getting started page covers impressions, views and watch time. Counts and rates. Neither publishes a composite score or index. If your term is not on the list, the platform did not hand anyone that number.
- Read the source document for a formula, a weighting, or an inputs list. Footnotes, small print under the chart, methodology section, appendix. You want which metrics feed the score, how they combine, and what the scale is. With none of the three, the number is a claim about arithmetic you were not shown.
Those are two glossaries, not the whole field. Step two only counts when you run it against whichever platform your own case study ran on. How often coined names turn up in published work is not counted here.
A hypothetical case: the “Brand Affinity Score”
This is hypothetical. It describes no real agency, campaign, or published case study, and the numbers are invented to show the mechanism.
Picture a case study reporting a Brand Affinity Score of 5.8. Three underlying figures appear further down: 4,000 saves, 1,200 shares, and 800 comments classed as positive, against 200,000 reach.
Suppose the score weights saves at one, shares at three, and comments at five, then divides by reach and multiplies by 100. That is 11,600 over 200,000, giving 5.8. The published figure checks out.
Now suppose the agency had instead judged a save the strongest intent signal, because saving is private and carries no social performance, and weighted saves at three, shares at one, comments at two. Same campaign, same inputs. That is 14,800 over 200,000, giving 7.4. Roughly 28 percent higher, from a weighting at least as defensible as the first.
Neither number is a fact about the campaign. Each is a fact about a weighting decision the undisclosed version never shows you.
Why an agency builds its own metric in the first place
Two motives, and they produce very different documents. The first is legitimate. Platform metrics are built for the platform’s purposes, and an agency running a long campaign about how a product is perceived has a real measurement problem, because no platform reports perception. Building a composite from available signals, and stating exactly how, is an honest answer to it.
The second is more ordinary. Standard platform numbers get recombined under a name that sounds more considered than “saves plus shares,” with nothing explaining the recipe. The result cannot be compared to last quarter or to anyone else’s work, because no shared definition exists. That is not proof of bad intent. Repackaging can be house style.
The name alone cannot tell you which motive produced it. Only disclosure can.
Disclosed versus undisclosed: what the difference actually looks like on the page
| What you check | Disclosed | Undisclosed |
|---|---|---|
| Inputs | Named individually | Not stated anywhere |
| Formula or weighting | Written out, enough to recalculate | Absent |
| Scale | Out of 100, indexed to a base period, or a rate per reach | Implied by the number, never defined |
| Methodology note | A footnote or appendix you can read | None |
What still holds up around an unverifiable score
An invented metric does not contaminate the page it sits on. Reach, follower counts, impressions, or a stated sales figure alongside it stay checkable on their own terms. Reach has a platform definition. A revenue number can be questioned about its window and its attribution, a conversation with a real shape.
So read the report as separate claims, not one verdict. A case study with one unverifiable metric has one unverifiable claim, not grounds to discard the document. If the coined score is the headline and the rest is small print, notice that ordering, because the best metric on a dashboard is rarely the whole story. For the general practice, see how to read a marketing case study without being misled.
See how other reports handle it
The fastest way to build the instinct is to read published work and notice which reports show their inputs. Browse the case study library, each entry credited to the agency behind it, or submit your own.
FAQ
Is a “quality engagement score” a real platform metric?
Not under that name in the platform documentation checked here, which lists counts and rates rather than composite scores. A name like this should prompt you to check whether the source document defines it, not to assume it came off a dashboard.
Is it always dishonest for an agency to invent a metric?
No. A disclosed methodology, with a stated formula and named inputs, is a legitimate way to measure what the platforms do not report. The problem is a coined name with a number attached and no disclosure anywhere in the document.
Sources
- Pinterest Business Help, Review Pinterest Analytics. Fetched 7 September 2026.
- YouTube Help, Get started with YouTube Analytics. Fetched 7 September 2026.