Engagement rate is three different metrics wearing one name
Two case studies, one reporting an engagement rate of 8 percent and the other 2 percent. The obvious reading is that the first did four times better. Before accepting it, settle what number sat underneath each percentage.
One post, three engagement rates
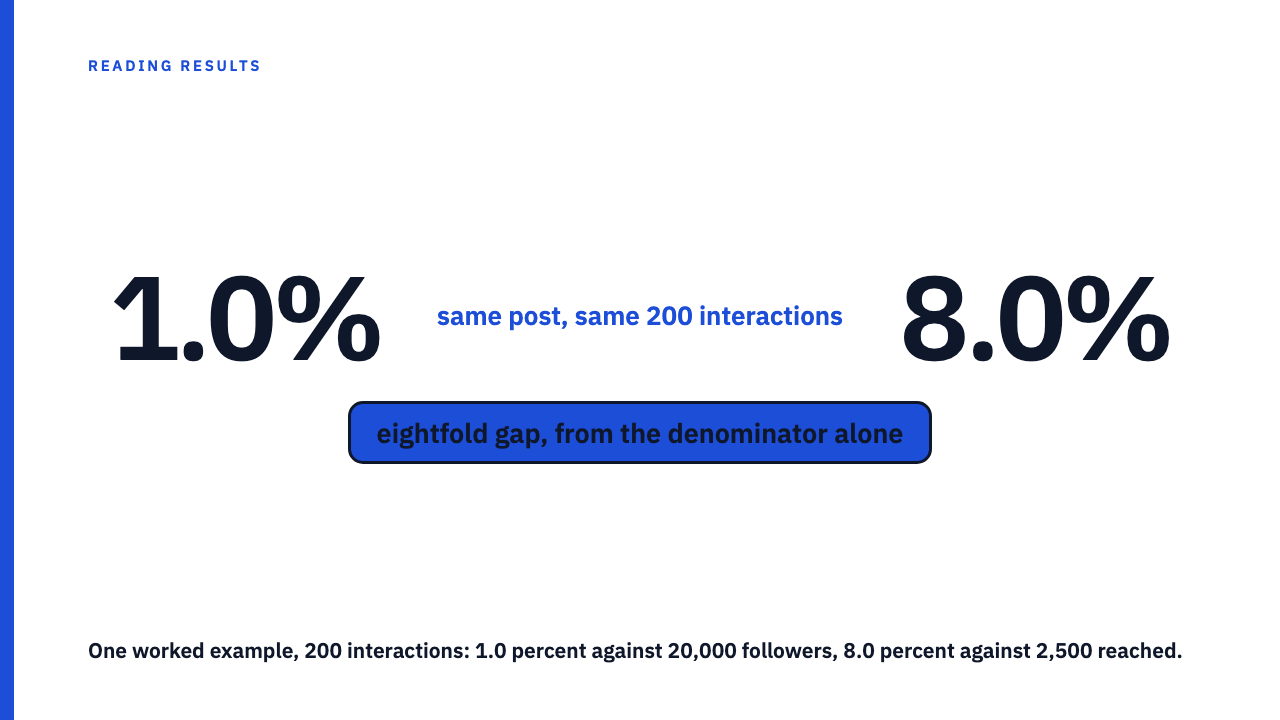
Consider a hypothetical post, with round numbers chosen for the arithmetic rather than from anybody’s report: 20,000 followers, 2,500 people reached, 4,000 impressions, and 200 total interactions.
Against followers, 200 divided by 20,000 is 1.0 percent. Against reach, 200 divided by 2,500 is 8.0 percent. Against impressions, 200 divided by 4,000 is 5.0 percent.
All three describe the same activity: same post, same 200 interactions. The eightfold gap between highest and lowest comes entirely from the choice of denominator.
So your 8 percent and your 2 percent may be identical performance measured two ways, or a real difference. Without the denominators there is no way to tell which, which is the specific case of reading a case study without being misled: a percentage is not a fact until you know its base.
The three denominators are not measuring the same thing
This is not carelessness. The three are distinct quantities, each a defensible base. Followers is audience size, counting people who subscribed and saying nothing about whether any of them saw the post. It has no fixed relationship to the other two, so a follower-based rate can sit above or below them depending on how much of its audience the post reached.
Reach counts people, the different people or households exposed at least once during the period. Impressions counts events, one each time the content is fetched and served, so a second view by the same person is a second impression.
Frequency, the number of exposures per person in a time frame, is impressions divided by reach. Anyone counted in reach was exposed at least once, so frequency cannot average below one and impressions is always greater than or equal to reach. Hold the numerator still and the impression-based rate can never exceed the reach-based one.
Each rate moves for reasons that have nothing to do with the work
The follower-based rate falls as an account grows, even when the same number of people engage, and rises when inactive followers are pruned. Growth and this rate pull against each other.
The reach-based rate rewards narrow distribution: highest when a post lands on the most committed part of the audience, lower when it travels to people with no prior relationship. Wider distribution looks like worse performance.
The impression-based rate is diluted by repeat exposure. A post shown twice to everyone it reached adds no new candidates to engage but doubles the denominator, roughly halving the rate reach would have given.
Somebody holding all three and choosing afterwards can pick the most flattering while fabricating nothing, which is why the choice has to be disclosed rather than trusted.
The numerator is unsettled too
Fixing the denominator settles only half of it. The count on top is convention too. Any of these may or may not sit inside a reported total: likes, comments, shares, saves, follows gained, profile visits, link clicks, sticker or poll taps, and video plays.
Video plays are the sharpest case. They can outnumber every other interaction combined, so including them produces a view rate wearing the engagement rate label.
Reporting surfaces differ in which of these they bundle, so two reports can agree on the denominator and still disagree on the rate. Ask what is in the numerator in the same breath as the denominator.
What to ask before you compare two figures
Five questions.
| Ask | Unusable answer | Usable answer |
|---|---|---|
| Which denominator? | “The platform default”, or silence. Defaults differ by platform and surface. | Followers, reach or impressions, named. |
| Which interactions are in the numerator? | “Total engagement”. | An itemised list, showing whether video plays are in it. |
| The raw counts? | The percentage alone. | Numerator and denominator as absolute numbers, so you can recompute all three rates. |
| One post, an average, or a period total over a period denominator? | Not saying which. | A stated choice. A per-post average and a period ratio differ. |
| What window? | No dates. | A start and an end. Engagement accrues after publication, so 24 hours and 30 days differ. |
When nobody will tell you the denominator
Often nobody is answering, and there is still a rule. If the report gives any two of the numerator, followers, reach and impressions, compute the rate yourself instead of accepting the printed percentage. Where the two disagree, the disagreement is the finding.
If it gives the percentage alone, the figure is unranked. Not low, not high, unranked, which means excluding it from the comparison, not scoring it weak.
An undisclosed denominator is a reporting defect, not proof of bad faith, so the response is a question rather than an accusation. Note that every case study library is a selected sample. Then apply the test to your own reporting: a rate whose base you cannot state is one you cannot defend.
See how others report it
Every number in the library’s 10 case studies belongs to the agency that reported it, not to a benchmark. Browse the case study library and check whether each percentage states its base, or submit your own.
FAQ
Which denominator is the correct one?
There is no single correct one. Reach is the most defensible base for asking what share of the people who saw it responded, since it counts people rather than exposures. Impressions answers a different but legitimate question, response per exposure. Followers answers neither. The requirement is disclosure, not a particular choice.
Can I convert a follower-based rate into a reach-based one?
Not without that post’s reach figure. The conversion needs the ratio of reach to followers for that specific post, which is not derivable from the rate itself and varies enormously between posts on the same account. There is no multiplier worth offering.
Is a higher engagement rate always better?
No. Distributing a post to the most committed slice of an audience raises the rate while reaching fewer people. A ratio improves when its base shrinks, so read the percentage alongside the absolute counts.
What if a case study gives an engagement rate with no other numbers at all?
Treat the figure as uninterpretable and ask for the raw counts. Uninterpretable is not the same as false. The claim may be accurate and still unplaceable, so exclude it from the comparison rather than scoring it low.
Sources
- Impression (online media), Wikipedia, fetched 2026-08-26.
- Reach (advertising), Wikipedia, fetched 2026-08-26.
- Frequency (marketing), Wikipedia, fetched 2026-08-26.