Up 60% on Last Year? Check Whether Last Year Was Normal
A case study says the account was up 60 percent on last year, and you want to believe it. Before you do, there is a cheaper question than “how did they do it”: was last year a normal year to beat? A year-over-year percentage is a ratio, and either half of the ratio can be the odd one.
The percentage belongs to the base as much as the result
Percent change is (this year minus last year) divided by last year. Last year sits underneath the fraction, so the smaller it is, the bigger the percentage that comes out, even when this year is unremarkable. Economists call this the base effect: a low starting value turns a given absolute change into a larger percentage change, and a high starting value does the opposite.
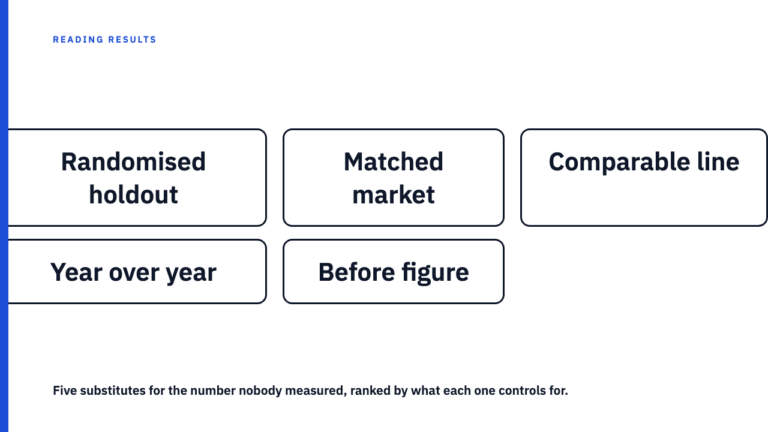
This post is about one specific case, where the prior period was itself abnormal. It is a different problem from the ‘before’ picture in a case study is also a choice, where someone selects the comparison window, and from seasonal tailwind mistaken for campaign effect, where the calendar does the lifting.
A worked example with three years (hypothetical)
HYPOTHETICAL. These numbers are invented for illustration. They are index units, not currency or followers of any real account, and they are not a reported result from any agency or library entry.
| Year | Index (hypothetical) | Change from previous year |
|---|---|---|
| Year 1 | 100 | n/a |
| Year 2 | 62.5 | down 37.5% |
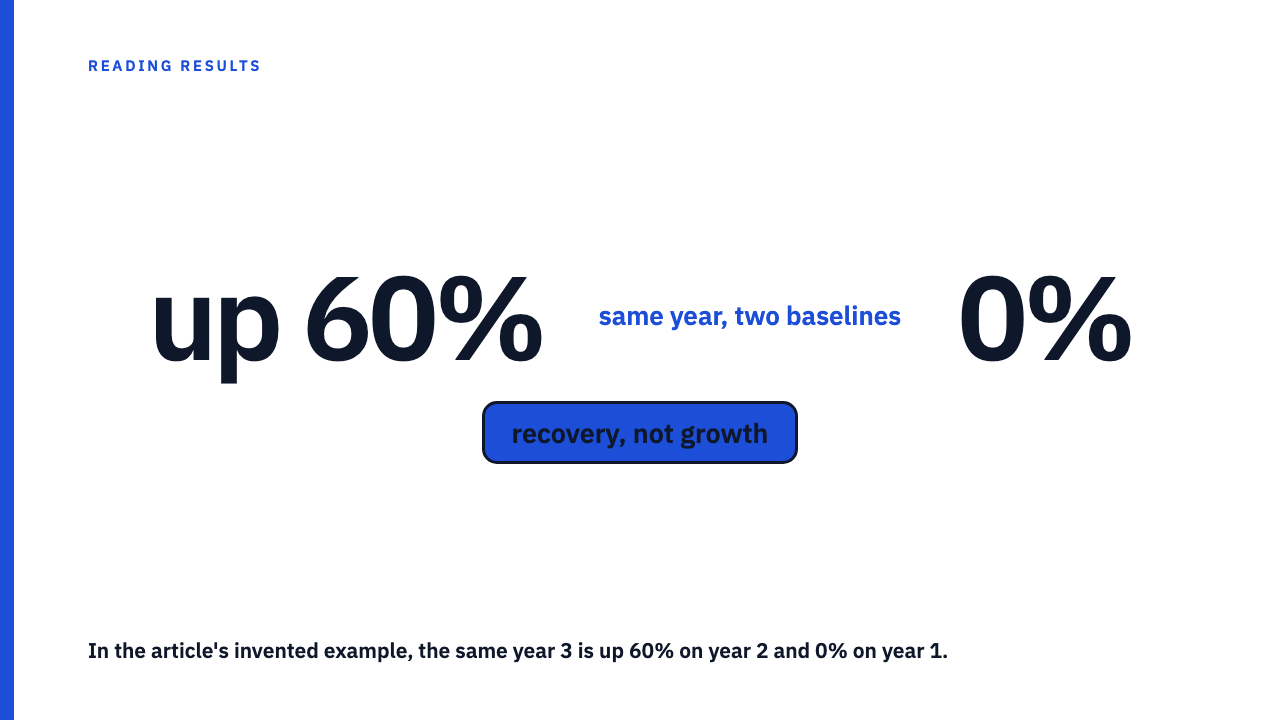
| Year 3 | 100 | up 60% |
The arithmetic: Year 3 against Year 2 is (100 minus 62.5) divided by 62.5, which is 0.6, or up 60 percent. Year 3 against Year 1 is (100 minus 100) divided by 100, which is 0 percent. Year 2 against Year 1 is (62.5 minus 100) divided by 100, which is down 37.5 percent.
The 60 percent is true arithmetic. It still tells you nothing about whether anything improved, only that the figure recovered. And notice the asymmetry: a 37.5 percent fall needs a 60 percent rise just to get back to even, because the rise is measured from a smaller number. The same lopsidedness is behind percent change versus percentage points confusions. The formula itself is set out on the Wikipedia page for percentage change.
Why a prior year ends up abnormal
A comparison year can be off in three distinct ways, and each pushes the later percentage in a known direction.
The first is a depressed year: operations paused, a budget cut, an account left dormant, a team in transition, a year the business was closed or partly closed. A depressed base inflates the next year’s gain, which is the situation in the table above.
The second is an inflated year: a one-off spike, a launch, a paid push that was not repeated. An inflated base does the reverse. It can hide a real gain, or manufacture a decline out of a perfectly healthy follow-up year.
The third is a year that was measured differently: tracking changed, or a metric was redefined partway through. The two numbers then measure different things.
The second-reference-year test
The method is to compare the current year with a year other than last year and see whether the story survives.
- Find three numbers: the current year, last year, and one earlier year.
- Compute the gain of the current year against each of the two earlier years.
- Compare the two percentages.
- If they diverge widely, ask what happened in the in-between year.
As a rule of thumb, not a statistical threshold: if the gain against the earlier year is near zero or negative, the headline is mostly recovery.
Run it in reverse too. If the prior year was unusually strong, a flat or modest result against it may be better than it looks, since the base was high. The test cuts both ways.
If the case study gives only one prior year, ask for the earlier figure, or look for a chart with a longer axis.
What the case study has to tell you for the test to work
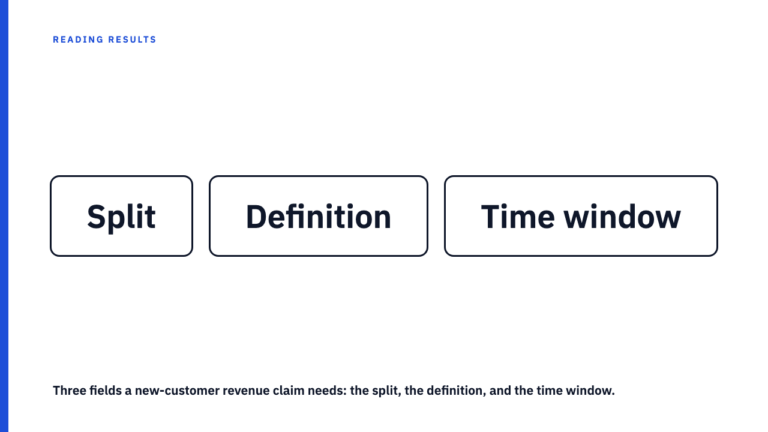
Three things make an abnormal base visible. The raw numbers for the prior period, not only the percentage. The dates of each period, so you know what is being compared with what. And any note about changes in activity, budget or tracking during the prior period.
A lone percentage with no raw base cannot be tested at all. You have a ratio and no way to know which half is odd.
None of this means the claim is wrong. It may well be fine, and the earlier year may have been perfectly ordinary. You want it to be true. You are simply checking before you repeat it.
Recovery is not worthless, but it is a different claim
An agency that took a depressed account back to normal may have done real work. The point is to word it honestly. There are three different claims, and a reader can restate each in one line:
- Growth beyond the earlier norm: “The account now performs above where it was before the dip.”
- Return to the earlier norm: “The account is back to where it was before the dip.”
- Partial recovery: “The account is up on the low year but still below the earlier level.”
One more caution. A bad year followed by a better one can happen with no intervention at all, because extreme results tend to be followed by less extreme ones. That is regression to the mean, described more generally on Wikipedia under regression toward the mean.
A quick check you can run on any year-over-year claim
Four questions, in order:
- What was last year?
- Was it a normal year, or was something paused, spiked or re-measured?
- What does the year before show, and does the gain survive against it?
- What is the raw number behind the percentage?
To practise on real write-ups, browse the case study library, and look for the base before you look for the lift. Agencies are welcome to submit your own work, ideally with the raw prior-period figures included.
FAQ
What is the base effect in marketing results?
A percentage change depends on the starting figure, so an unusually low starting period makes any later result look like a large gain. The term comes from economics, where it is used for the same distortion in growth rates.
How do I test whether last year was a normal year?
Compare the current figure with a second reference year and compute the gain against both. If the two percentages differ sharply, the prior year is a suspect base. A third data point is a check, not a proof.
Sources
- Base effect, Wikipedia, fetched 2026-10-05
- Percentage change, Wikipedia, fetched 2026-10-05
- Regression toward the mean, Wikipedia, fetched 2026-10-05