A Cheap Result at Small Budget Won’t Hold at 10x Spend
A case study reports a cost per result that looks excellent, and the campaign behind it was small. You are planning something ten times the size, and the arithmetic is right there: divide your bigger budget by their figure and read off the number of results. That move is the one to check before you trust it.
The number is true at the budget it was measured at
Start by granting the claim. The cost per result in a case study may be entirely honest. The sensible stance is to want it to be true, then check what budget it was true at. A cost per result is an average over the spend that produced it. Total spend divided by total results. It describes the campaign as a whole, at the size it ran, and says nothing about what the next result would have cost.
The naive move runs like this: the report says $2.00 per result, you have ten times the money, so you expect ten times the results. That forecast quietly assumes every added dollar buys exactly what the early dollars bought. The figure cannot confirm that, because it was never measured on the added dollars.
Why the first dollars are the cheapest ones
The general idea is old and well described. In economics, diminishing returns means that as you add more of one input while holding the rest fixed, each extra unit eventually yields a smaller extra output.
In paid social, the commonly described mechanism is easy to reason through. A small budget can be spent on the best-fitting audience and the best placements, the people most likely to respond. A larger budget has to go past them, into people who fit slightly less well. Repeated exposure adds a second pressure: once the most responsive people have seen the message several times, further impressions to the same people tend to add less than the first ones did.
This is where two terms need separating. Average cost is total spend divided by total results. Marginal cost is what the last slice of spend bought: the extra spend divided by the extra results. A case study almost always reports the first. A budget plan needs the second.
Where the curve bends is specific to the account, the audience and the period, so no general number applies. Some campaigns scale well. The small-test figure just cannot tell you which kind you have.
A worked example: one campaign, four budgets (hypothetical)
Everything in this section is hypothetical. The figures below were invented to show the arithmetic. They are not drawn from any real campaign or from any entry in our library.
Picture one campaign measured at four total budgets.
| Total spend | Total results | Average cost per result | Spend added | Results added | Marginal cost per added result |
|---|---|---|---|---|---|
| $1,000 | 500 | $2.00 | $1,000 | 500 | $2.00 |
| $2,000 | 900 | $2.22 | $1,000 | 400 | $2.50 |
| $5,000 | 1,800 | $2.78 | $3,000 | 900 | $3.33 |
| $10,000 | 2,800 | $3.57 | $5,000 | 1,000 | $5.00 |
Hypothetical figures, not drawn from any real campaign or library entry.
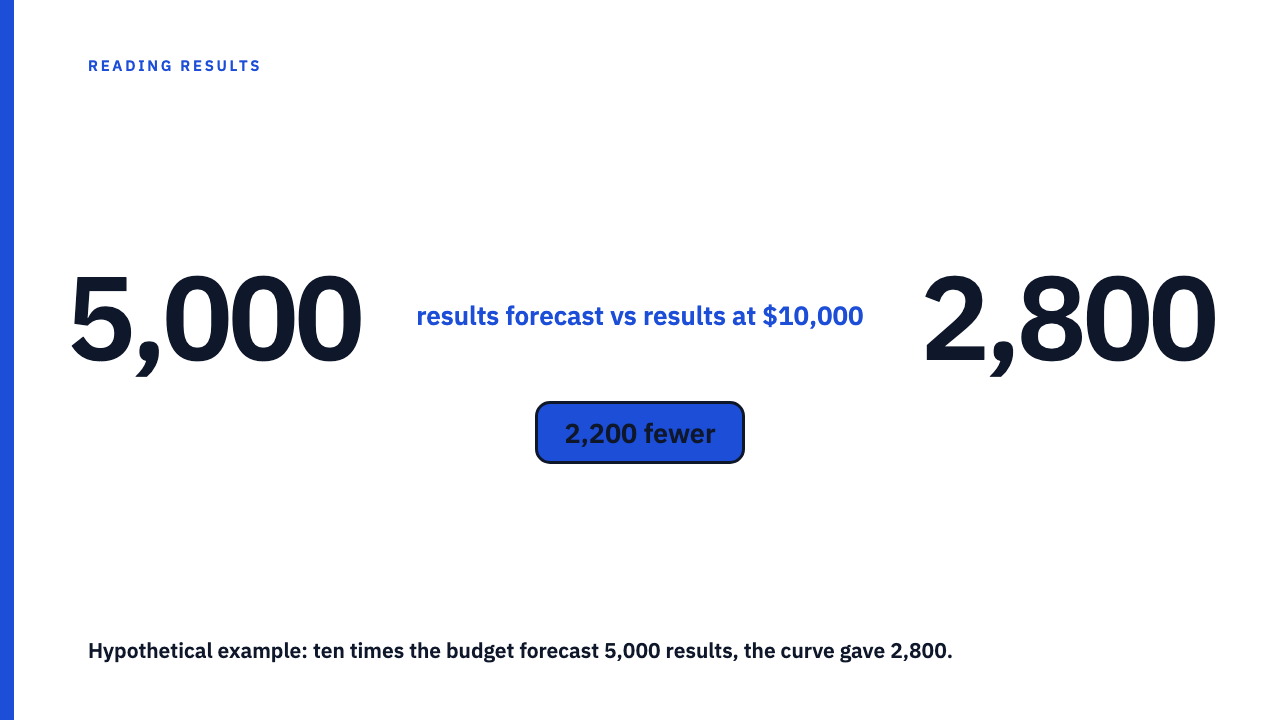
The naive reading of the first row is $2.00 per result, so ten times the budget gives 5,000 results. The curve in this example gives 2,800, which is 2,200 fewer. The average cost at $10,000 is about $3.57, and the last $5,000 bought results at $5.00 each, two and a half times the opening price.
Notice what is not in the table: a failure. Every tier still produced results, and the campaign may well be worth running at $10,000, depending on what a result is worth. The forecast was wrong. Scaling was not a mistake. This is the same family of error as when cumulative totals can rise while the rate falls: the total keeps growing while the efficiency of each addition declines.
What to look for in the case study itself
Four checks.
- Is the spend stated at all? A cost per result with no spend attached cannot be placed on any curve.
- Did spend change during the window? A campaign that ramped from small to large and reports one blended figure is hiding the curve. Ask for the figure by spend tier or by week.
- Is the efficiency the average over the whole window, or the best period within it? This is close kin to a cherry-picked reporting window.
- Did the audience stay the same as spend rose? If it was widened to absorb the extra money, the later results came from a different, probably less responsive pool.
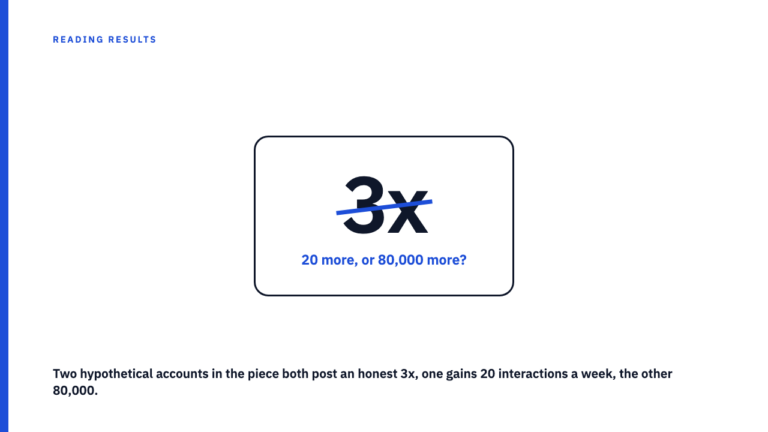
Now apply them to a hypothetical sentence: “We achieved a low cost per lead on a modest test budget.” Three questions follow at once. How modest, in actual dollars? Was that the budget for the whole window, or did it vary? Is “low” the average across everything, or the best stretch? Until those are answered, the sentence supports a mood, not a forecast. It is the same trap as when multiplier claims hide the base, where the figure’s size depends on a base the reader is not shown.
When a small-budget result is still useful
None of this makes a small test worthless. It legitimately shows that the offer, the creative or the targeting can work at all, and it hints at where a ceiling on cost might sit.
What it gives you is a floor on cost, not a forecast. It is a best case for the average cost, which is the opposite of what a budget plan needs.
The stronger evidence is a case study that reports results at more than one budget level, or one built on an incrementality or holdout design, which can show what added spend actually adds. We cover that standard in our piece on holdout tests.
Questions to put to the agency before you plan the larger budget
Four literal questions, usable as written:
- What was the total spend behind this figure?
- Did the spend change during the reporting window, and if so, when?
- What did the last portion of spend cost compared with the first?
- Is there a result at a higher budget?
If the answer is a refusal, or an evasive one, read it without accusing anyone. It most likely means the claim cannot be extended beyond the budget it was measured at. It does not mean the claim is false.
Browse the case study library to practise these checks on published work, or submit your own with the spend stated.
FAQ
What is marginal cost per result?
It is the extra spend divided by the extra results when a budget moves from one level to the next. In the hypothetical table, going from $5,000 to $10,000 adds $5,000 and 1,000 results, so the marginal cost is $5.00, even though the average at $10,000 is about $3.57.
What should a case study say about budget?
The total spend, whether spend changed over the window, and ideally results at more than one spend level. Without these, an efficiency figure cannot be placed on a curve.
Sources
- Diminishing returns (Wikipedia), fetched 2026-10-12, used only for the general definition.