Two Decimal Places Is Not the Same as Two Digits of Proof
You are reading a case study and the headline result is a lift of 37.42 percent. The two decimal places do something before you have decided anything: they read as careful, as measured, as a number someone checked. But a number can be typed to any precision regardless of how well it was measured. Here is how to tell reported precision from the real thing.
Reported precision and measured precision are two different things
Two separate quantities hide inside any printed number. Reported precision is how many digits are written down. Measured precision is how many digits the data can justify. A result quoted as 37.42 percent has four digits of reported precision. Whether it has four digits of measured precision is a different question, one the report almost never answers on the same line.
The rule that connects them is short. Reported precision should never exceed measured precision. When it does, the surplus digits carry no information. They are not false, they are empty: a different but equally valid measurement would have produced different digits in those places. Neutral references on significant figures say as much: digits beyond the precision the measurement supports are not meaningful, and how many digits a result can justify is governed by the uncertainty behind it. Trailing decimals tell you how carefully a number was formatted, not how carefully it was measured.
Why a small sample cannot support a two-decimal result
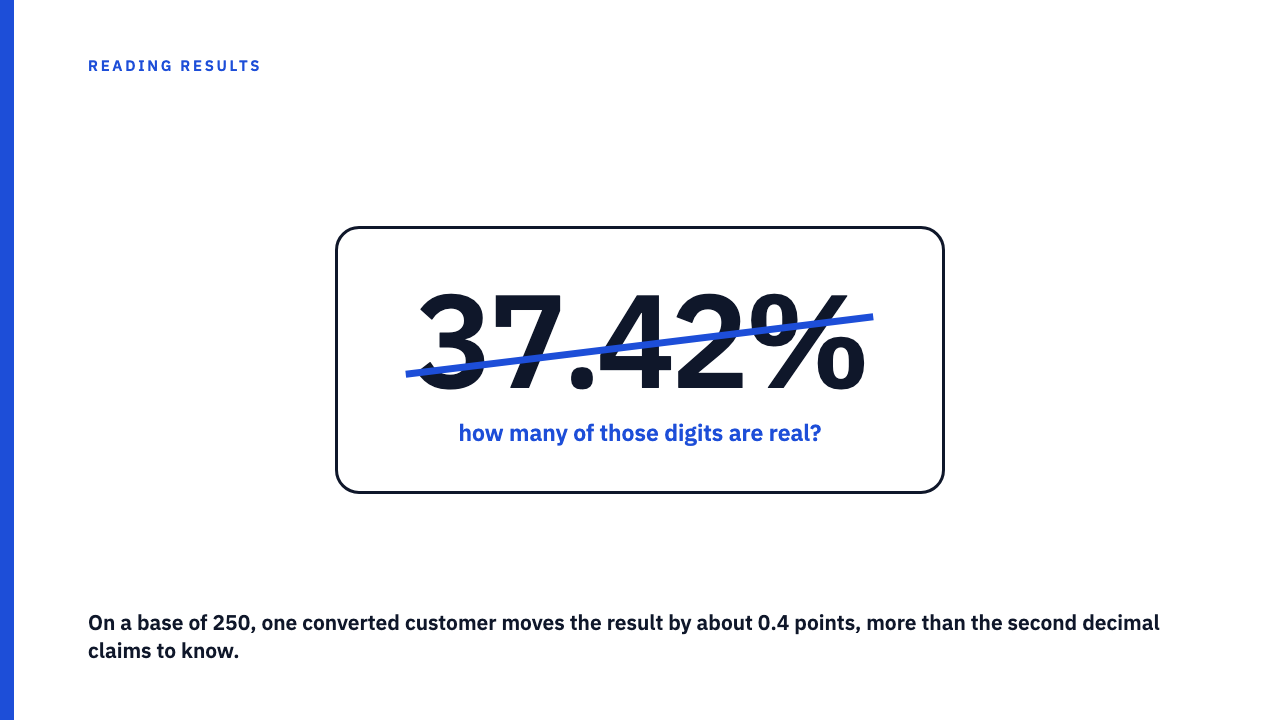
Consider a hypothetical test, with numbers invented to show the mechanism and describing no real campaign. A landing page is shown to 250 people, of whom 93 convert. That is 93 divided by 250, or 37.2 percent. Change the outcome by one person: 94 gives 37.6 percent, 92 gives 36.8 percent. A single conversion, either way, moves the figure by roughly 0.4 points.
Look at what that does to the second decimal place. A report that quotes this as 37.20 percent presents the digit after the point as fixed. But adding one customer to the numerator, one who might just as easily have bought or not, changes it to 37.6. That second decimal is not merely uncertain, it sits inside the range a single person swings. The report prints as settled a digit one coin flip would rewrite.
This is a property of the base, not of the campaign. The smaller the denominator, the larger the jump each outcome causes, so the coarser the smallest honest unit of the percentage becomes. On 250 people the smallest step is about 0.4 points. On 50 people it is 2 full points and a decimal is pure decoration. Decimals earn their place only on a base large enough to support them, and you cannot know which case you face until you know the denominator.
How to read the digits in a results claim
Three questions do most of the work on any reported number.
- What was the denominator? The sample size caps how many digits are meaningful, so a percentage without a base is one you cannot audit. Decimals for the win with no number behind it means the precision is unbacked.
- Do the extra digits change any decision you would make? If your reaction to 37 percent and to 37.42 percent is identical, the decimals are decoration.
- Does the precision match the base? Watch for the mismatch: a headline quoted to two decimals sitting on a sample of a few hundred, or a case study that reports the win to the hundredths while staying silent about the group behind it. That gap between stated precision and stated base is the tell. For why small bases make trailing digits meaningless, this site has covered when the base is small, the percentage is mostly noise, and how much a metric moves on its own.
Where false precision comes from, and why it is not always a lie
It is tempting to read spurious decimals as deception, but most of the time no one decided anything. Divide two whole numbers in a spreadsheet and it hands you a long tail of decimals by default, and someone copies the first few straight into the deck. Nobody measured to the hundredths; the software produced digits and a human pasted them. That is worth separating from the case where rounding does honest work. Rounding to reflect how coarse the measurement really is, and stating the base so the reader can see why, is careful reporting; rounding done to hide a tiny sample is the opposite. The distinguishing feature is not the number of digits, it is whether the report tells you the base. This is the same careful reading the site applies to reading percentage claims carefully.
So the practical stance is measured, in both senses. Treat unearned decimals as noise, not proof of a lie. Read the number at the precision the base supports, and reserve the charge of bad faith for reports that hide the base entirely. Most of the time you are not catching a liar, you are correcting a spreadsheet.
Read the rest of the library
If reading results claims closely is the habit you are building, the rest of this site is built around it. Browse the case study library to see how published results hold up, and if you have one of your own, submit your own.
FAQ
Is a result reported to two decimals more reliable than a rounded one?
No. The extra digits reflect how the number was formatted, not how well it was measured. Reliability comes from the sample and method behind the figure, how many observations it rests on and how the measurement was made, none of which changes when you add or drop a decimal. A carefully measured result rounded to whole numbers beats a shaky one printed to the hundredths.
How many significant figures should a percentage from a small sample have?
There is no fixed universal threshold, because the sample size sets the ceiling. With a few hundred observations, one or two significant figures is usually all the data can support, since each single outcome already moves the figure by several tenths of a point. Rather than memorising a number, check the denominator and let it cap the digits. A reference on significant figures lays out the principle that digits beyond the measurement’s precision are not meaningful.
Sources
- Significant figures (Wikipedia), on rounding to significant figures and implied uncertainty. Fetched 2026-09-15.
- Uncertainty of Measurement Results (NIST), on how a result’s uncertainty governs how many digits are worth reporting. Fetched 2026-09-15.