A Two-Entry Industry Tag Is Not a Sample
You filter a case study library by industry, and it hands back one entry, two entries, or none at all. The next move feels automatic: read what is there and treat it as a picture of what works in that industry. That move is the problem this piece is about.
What happens when you filter this library by industry
The action is simple. Click an industry tag, hospitality, healthcare, SaaS, and the page returns however many case studies carry it. Sometimes one, several, or none.
The instinct that follows is easy to miss. Whatever comes back gets read as representative: two hospitality case studies both mention a lift in bookings, so social apparently drives bookings for hotels, or one SaaS case study reports a strong result and that becomes the expected shape for SaaS companies. The filter never claimed to be a benchmark.
This differs from a mistake covered before, a single case study’s own small base, where a percentage rests on a denominator too thin to support it. That lives inside one report. This lives at the level of the whole library, before you treat what several case studies under one tag share as a fact about the industry.
What this library’s industry tags actually hold right now
| Industry tag | Case studies currently tagged |
|---|---|
| AI | 0 |
| Consumer Electronics | 0 |
| Consumer goods | 0 |
| Ecommerce | 0 |
| Education | 0 |
| Finance | 0 |
| Fintech | 0 |
| Gaming | 0 |
| Genetics/DTC | 0 |
| Government | 0 |
| Marketplace | 0 |
| Restaurant | 0 |
| Technology | 0 |
| Healthcare | 1 |
| SaaS | 1 |
| Hospitality | 2 |
| Local Business | 2 |
| E-commerce | 4 |
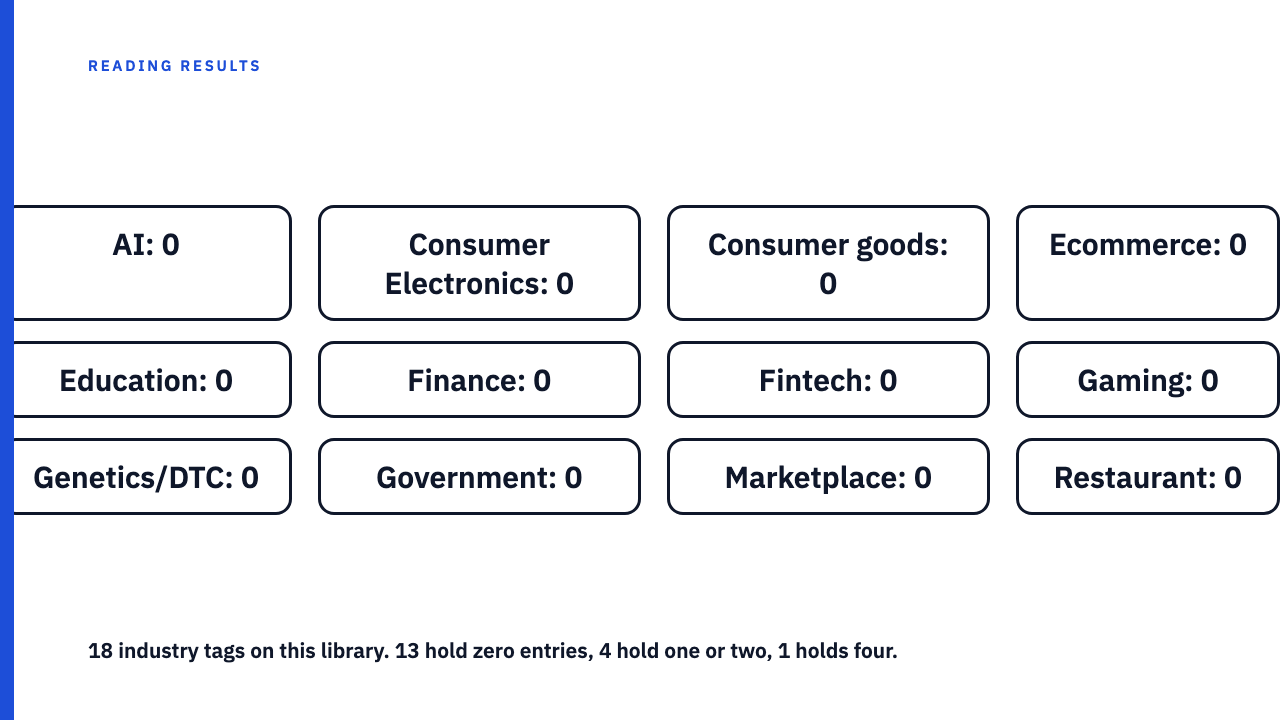
This library carries 18 industry tags across 10 published case studies. Thirteen of those 18 tags hold zero entries. Healthcare and SaaS each hold one. Hospitality and Local Business each hold two. E-commerce holds four, the largest of any tag, still a small base to generalise from.
These counts describe this library on the day this post was written and will change. Do not carry them into a later post.
Why one or two entries cannot support a pattern
Start with one entry: one agency’s one reported result, not a distribution, since a distribution needs more than one point to have a shape. Reading it as representative of an industry treats a sample of one as though it were a sample.
Two entries change little. A shared result could come from a shared template, a common vendor, a habit of only publishing good results, or plain coincidence, none of which requires the industry to behave that way.
A positive result in both entries is a 100 percent match rate, which sounds like strong evidence. It is not evidence of a rate at all. A rate needs enough independent trials that the proportion could plausibly differ, and two case studies selected by whatever process got them published is not that. It is a fact about those two entries, full stop, and says nothing about the industry.
A hypothetical worked example: two hospitality results and the pattern a reader might wrongly draw
This example is entirely hypothetical, invented for illustration, not drawn from any real case study anywhere.
A reader filtering by Hospitality finds two entries. The first, hypothetically, reports a hotel group seeing bookings rise 22 percent over a campaign window. The second, also hypothetically, reports a boutique hotel chain seeing bookings rise 19 percent. A conclusion writes itself: social media reliably drives bookings for hotels.
That does not follow. Two data points cannot separate different explanations for the same observation. Social media might genuinely lift hotel bookings, or the two agencies might have both succeeded for reasons specific to each account, unrelated to hospitality as a category, or agencies here might only submit a case study when the number came out well. A pattern fitting several explanations equally is about which two stories reached the page, not the industry.
This must not be confused with an actual reported result. Every real number belongs to the agency that reported it, and none is restated as an industry finding.
Why this differs from a small base inside one case study
This site has already written about a related but distinct mistake. when the base inside a single case study is small is about a percentage computed from a small denominator inside one report, a “conversions doubled” claim that means two conversions became four.
This piece works at a different level: how many separate case studies a filter returns across the whole library, and whether that count says anything about the industry named. One is a within-post metric problem. The other is a library structure problem, and it exists regardless of how clean the individual report is.
What a thin tag can and cannot tell you
- One entry tells you one agency reported one result in that industry. Nothing more.
- Two or three entries suggest a question worth checking elsewhere, not an answer.
- Before treating a shared feature among entries as a pattern, check how many entries the tag holds.
- Ask whether the library’s own selection, what gets submitted and published, could explain a similarity before the industry does. every case study library is a selected sample.
- Treat a count as a snapshot, not a permanent fact.
The wider habit is how to read a case study without being misled, applied to the shelf a case study sits on. The category error is the one in someone else’s case study result is not your benchmark: a thin tag is the mistake at filter scale.
Read the library, don’t just borrow from it
Browse the case study library with the tag counts in mind rather than treating a filter as an industry verdict. If you have a result worth adding, you can submit your own case study, with full credit to your agency.
FAQ
How many case studies does an industry tag need before it means something?
There is no fixed number, but one or two entries sit closer to an anecdote than a sample. Treat a thin tag as a lead, not a conclusion.
Why do some industry tags on a case study library have zero entries?
A library only contains what agencies have submitted and published, so a zero count reflects submission history, not industry performance. On this site, 13 of 18 tags hold zero entries for that reason.
Sources
- context/casestudies/facts.json, generated 2026-09-09, this site’s own first-party count of industry tags and published case studies. Checked 2026-09-09.
- https://socialcasestudies.com/blog/small-numbers-big-percentages/, checked 2026-09-09, HTTP 200.
- https://socialcasestudies.com/blog/survivorship-bias-case-study-library/, checked 2026-09-09, HTTP 200.
- https://socialcasestudies.com/blog/how-to-read-a-case-study/, checked 2026-09-09, HTTP 200.
- https://socialcasestudies.com/blog/borrowed-benchmark-category-error/, checked 2026-09-09, HTTP 200.
- https://socialcasestudies.com/blog/case-studies/, checked 2026-09-09, HTTP 200.
- https://socialcasestudies.com/submit-your-case-study/, checked 2026-09-09, HTTP 200.