When the Before and After Charts Don’t Use the Same Scale
You are looking at a two panel chart in a case study. Before on the left, after on the right, and the jump between them looks steep, the kind that makes you sit up. Then you read the percentage in the caption and it is real, but modest. Fifteen percent, maybe twenty, nowhere near as dramatic as the picture suggests. So which one do you believe, the number or the shape?
The two panel graphic is doing more work than the caption admits
A before and after pair persuades on its own, separate from the number beside it. Two bars, one taller than the other, and the eye reads that gap before it reaches the caption. That is how comparison charts work, and it means the image can carry an argument the text has not made. A case study can state an accurate percentage and still hand you a picture engineered to look bigger than that percentage supports, which is why the picture is worth checking on its own terms.
This is a different defect from a screenshot with no visible date range. A missing date range is about whether you can check the time window at all. A scale mismatch is about whether, once both charts are visible, they are drawn on the same terms. A chart can pass the date test and fail this one, or the reverse.
Four ways two screenshots in the same case study stop being comparable
- Different y axis scale or range. An axis running 0 to 100 next to one running 40 to 60 makes near equal bar heights represent very different values, and a small numeric gap look enormous.
- Different zoom or crop level. One panel shows the full chart with gridlines and labels; the other is cropped tight around one bar. The tighter crop is less checkable and makes what remains look bigger.
- A change in chart type. A bar before, a line after, changes what the eye measures. A bar’s height reads as one value; a line’s slope reads as a rate of change, even when the numbers moved exactly as stated.
- A different aggregation window inside each panel. Daily values before, weekly totals after, produce a smoother or spikier line independent of what actually happened.
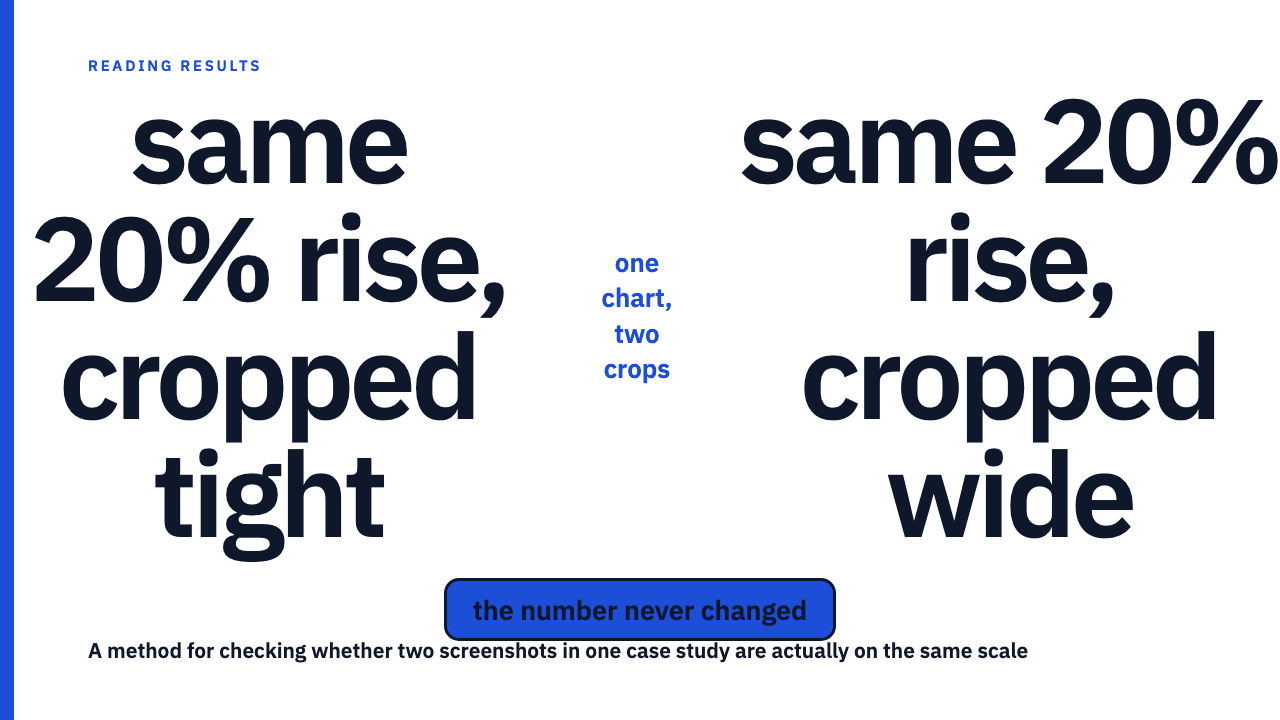
A hypothetical worked example: the same 20 percent rise, drawn two ways
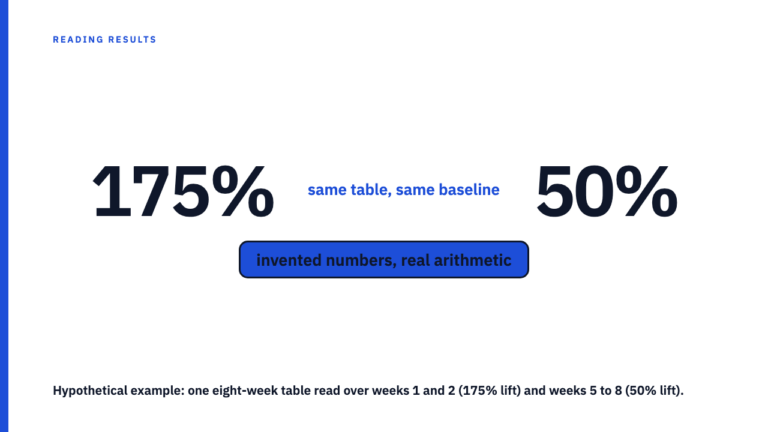
Picture a hypothetical metric, weekly saves on a post, that genuinely rose 20 percent between two periods. This number is invented for this explanation, not drawn from any real case study or agency. Say it moved from a hypothetical 500 to a hypothetical 600.
Drawn one way, the y axis starts at 480, just under the lower value, and the bar for 600 towers over the bar for 500, close to doubling by eye. Drawn a second way, the axis starts at 0, and the same two bars sit close together, a modest step rather than a leap. Both drawings are accurate. A zoomed axis is not automatically a lie; it can legitimately make a small but real change visible at all. The underlying change is identical in both. Only the axis choice differs, and it is doing all the work of making the same fact look dramatic or unremarkable.
Crop the axis labels out of either version, leaving only the bars, and you cannot tell which drawing you are looking at, because the one detail that would tell you apart has left with the crop.
What to check before you trust the jump
- Look for visible axis labels on both panels, then check whether the range and increments match. Different steps at different scales are not the same ruler.
- Confirm both panels use the same chart type and the same time aggregation. A bar next to a line, or daily next to weekly, means you are not looking at the same measurement drawn twice.
- Compare the size of the visual gap to the stated percentage change, roughly. A modest caption next to a picture that reads like a cliff is worth treating as a flag rather than proof of dishonesty.
- Remember a scale difference can be entirely ordinary, a dashboard redesign or a metric that switched platforms and inherited a different default axis. Ask the agency to confirm both panels are on the same scale rather than assuming bad faith.
Why this is a chart design defect, not a missing metadata defect
Keep this separate from how to read a results chart before you read the caption, the broader habit this piece narrows to one specific failure. A screenshot can show a clear date range and still mismatch its companion screenshot on scale or crop; disclosing when the data was captured says nothing about whether the two captures were drawn on the same terms. A chart can also be scaled consistently across both panels and still omit the date range, so you cannot check the time window even though the two pictures compare honestly to each other. The two defects are independent; clearing one does not clear the other.
The same caution applies upstream, in the before picture is also a choice: a scale mismatch is one way that earlier choice tilts the comparison. Pair it with the best metric on a dashboard is rarely the real story, since a favorable crop and a favorably chosen metric are two separate ways a dashboard can look better than it is. For the broader method, see how to read a marketing case study without being misled.
Before you take the next chart at face value
This takes about a minute: labels visible, ranges matching, same chart type, same aggregation, and a rough check between the size of the jump and the stated number. Browse more of this method in the case study library, or if your agency has a result worth adding, submit your own.
FAQ
If the two screenshots show different y axis ranges, does that mean the case study is lying?
No. A scale mismatch is a flag to ask about, not proof of dishonest intent. A metric change, a dashboard redesign, or a platform update between the two screenshots can produce a legitimate scale difference. Ask the agency to confirm both panels are on the same scale rather than assuming the worst.
Is this the same issue as a case study screenshot with no visible date range?
No. A missing date range means you cannot check the time window at all. A scale or crop mismatch means you can see two full charts and still not compare them honestly. A screenshot can fail one check, the other, both, or neither.
Sources
- How to Read a Results Chart Before You Read the Caption, socialcasestudies.com, fetched 2026-09-09.
- The ‘Before’ Picture in a Case Study Is Also a Choice, socialcasestudies.com, fetched 2026-09-09.
- Why the Best Metric on a Dashboard Is Rarely the Real Story, socialcasestudies.com, fetched 2026-09-09.
- How to Read a Marketing Case Study Without Being Misled, socialcasestudies.com, fetched 2026-09-09.