A New Format’s First Two Weeks Are Not Its Steady State
A case study says a brand-new format lifted engagement sharply over its first couple of weeks. You want to believe it, and you need to decide whether that number describes what you would get if you ran the same format for a quarter. The honest answer depends on a question the headline rarely answers: what did the weeks after launch look like?
The burst and the level are two different numbers
The novelty effect is the tendency for a response to be stronger partly because something is unfamiliar. People tap, watch and comment on a format they have not seen before, and some of that reaction fades as the format becomes ordinary. A general definition is on the Wikipedia entry.
The distinction the rest of this post rests on is simple. The launch-window figure describes the burst. The late-period figure describes the level the client actually lives with once the format is familiar. A short reporting window starting at launch is exposed to the burst in a way an established format is not, because an established format has no launch to measure.
Novelty is not always present and it is not always large. The point is to check, not to assume the result is inflated. Window choice matters generally, as in a 90-day headline from a 12-month campaign, but here the window can be honest and short and still mislead.
A hypothetical eight-week series, read two ways
This example is hypothetical. Every number below is invented to show the arithmetic. It is not a real reported result, not a benchmark, and not typical of anything.
Picture a made-up new format with a pre-launch baseline engagement rate of 2.0%. In the hypothetical table below, the weekly rate over the next eight weeks is:
| Week | Engagement rate (hypothetical) |
|---|---|
| Pre-launch baseline | 2.0% |
| 1 | 6.0% |
| 2 | 5.0% |
| 3 | 4.0% |
| 4 | 3.4% |
| 5 | 3.0% |
| 6 | 2.8% |
| 7 | 3.0% |
| 8 | 3.2% |
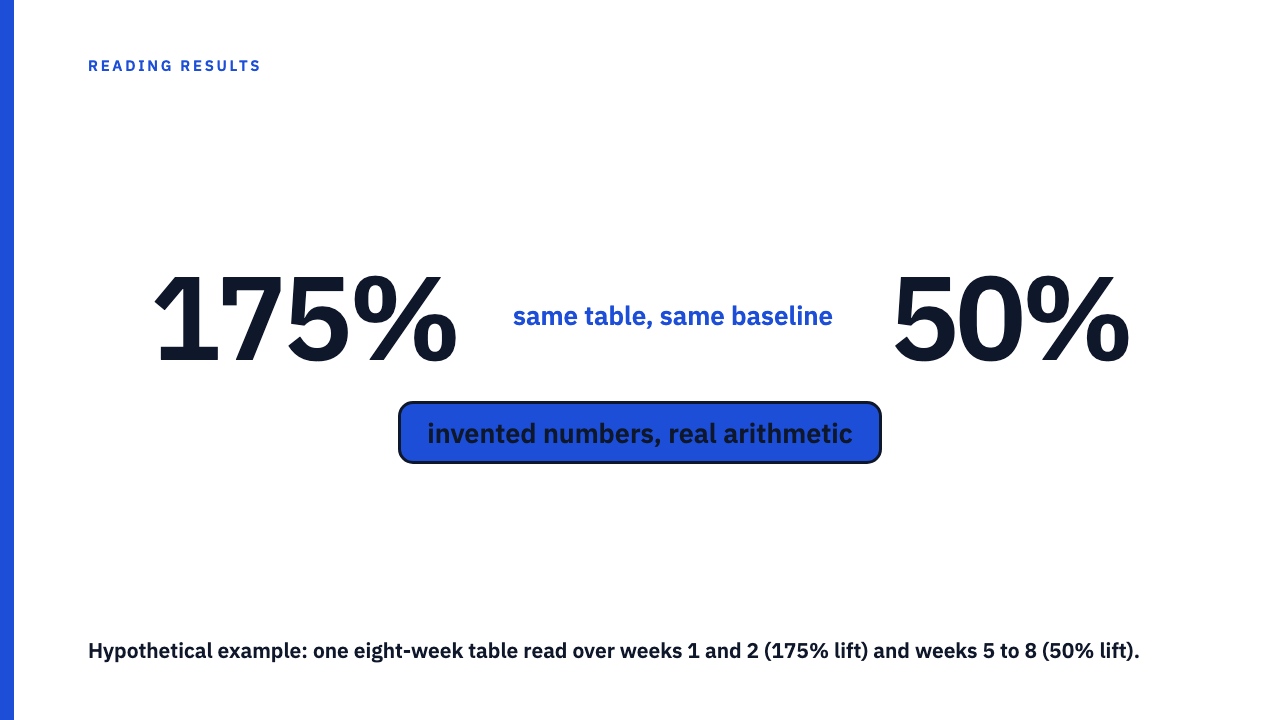
Headline one uses weeks 1 and 2. The average is (6.0 + 5.0) / 2 = 5.5%. Against a 2.0% baseline, that is 5.5 / 2.0 = 2.75 times the baseline, a lift of 175%.
Headline two uses weeks 5 to 8. The average is (3.0 + 2.8 + 3.0 + 3.2) / 4 = 3.0%. Against the same baseline, that is 1.5 times, a lift of 50%.
Same table, same baseline: 175% against 50%. In percentage points the gap is 3.5 against 1.0. A client who budgets from the first headline expects a level they will not see after the first month, and may conclude the format stopped working when it was settling.
What a decay curve looks like in a case study chart
The shape is a sharp early peak, then a downward slope that flattens into a plateau. Compare a ramp that keeps climbing, and a flat line from day one. Only the first raises the novelty question.
Many case study charts show only a cumulative total, and that hides the problem. A cumulative line keeps rising even when the weekly rate is falling, so the decay is invisible. We cover this in detail in cumulative totals can rise while the rate falls.
There is an honest ambiguity. A falling curve can also come from audience fatigue, a budget change or seasonality. A decay shape is a prompt for a question, not proof of novelty. It is also different from a contest’s follower spike that reverts, which has its own mechanism. For general habits, see how to read a results chart before the caption.
A curve that is flat or rising across several weeks reasonably supports the idea that the result was not a brief burst. It does not prove durability.
Five questions that separate burst from level
- Is a weekly or daily breakdown shown, or only one window total?
- When does the window start and end relative to launch, and is the final period reported separately? A window from launch to week two measures the burst by construction.
- Was the new format compared with an existing format run at the same time, or with a pre-launch baseline? A concurrent comparison is stronger, because both arms see the same calendar period, so seasonality and platform changes hit both. That is reasoning, not a measured result. A baseline comparison is where novelty does the most damage, since it sets an unfamiliar format against months of familiar ones.
- Was the effect measured on repeat exposure? The same people seeing it a second and third time may behave differently from first viewers.
- Does the agency report anything after the window? A follow-up figure, a later campaign using the same format, or a statement that the result held.
What the research on novelty and long-run effects says
This is a recognised problem, not an invented worry. The paper Novelty and Primacy: A Long-Term Estimator for Online Experiments (Sadeghi, Gupta, Gramatovici, Lu, Ai and Zhang, 2021) says that because experiments are typically limited in duration, observed treatment effects are not always stable and sometimes reveal increasing or decreasing patterns over time. It describes novelty as the desire to use new technology that tends to diminish over time.
The same paper names the opposite pattern, primacy: growing engagement as people adopt the change. So a short window can also understate a result, and cannot tell you which direction the effect will go.
One caution. That research concerns online product experiments. A social creative test is a looser setting, so the lesson transfers as a habit of asking about time, not as a size of effect.
How to word the follow-up to the agency
Keep it friendly and specific: “Thanks for sharing this. Could you share the weekly figures for the test period, or the result for the last two weeks of the window on its own? We want to understand the level once the format was familiar.”
Then read the answer in one of three ways:
- A weekly series arrives. Check the shape.
- A late-period figure arrives. Compare it with the headline. A small gap means the headline was a fair guide. A large gap means plan from the late figure.
- No breakdown exists. The claim stays as a launch-window result. That is a legitimate thing to write down.
Until a late-period figure exists, plan on a range between the burst and the level, not on the burst.
Keep reading
Browse the case study library to practise these questions on published work, or submit your own. Every number in the library belongs to the agency that reported it.
FAQ
What is the novelty effect?
It is the part of an early response that comes from unfamiliarity and fades as people get used to the format. Its opposite is primacy, where engagement grows as people adopt the change.
How long does a novelty effect last?
It varies by audience, format and how often people see it, so no single duration can be stated here. The way to find out for a given result is to ask for the weekly series.
Sources
- Novelty and Primacy: A Long-Term Estimator for Online Experiments, arXiv abstract page, fetched 2026-10-10
- Novelty effect, Wikipedia, fetched 2026-10-10