The ‘average 47% lift’ claim isn’t what it sounds like
Near the top of an agency’s results page sits a single sentence: our clients see an average 47 percent lift. It covers the whole book of business, not one flattering account, which is why it feels safe to repeat. But a claim like that can be built two ways, and the two land three times apart on identical data. Nothing says which one you are reading.
The number on the results page
A claim like that is built by averaging each client’s percentage change, not by measuring the combined before and after across the client base. It sounds like a total, stronger evidence than one case study, when it is a statistic about a list of ratios.
Why you cannot average an average
The error is precise: every percentage change has its own denominator, that client’s baseline, and averaging percentages throws those denominators away.
So a client that went from 20 units to 30 counts as much as one that went from 10,000 to 10,800. The first is a 50 percent change, the second is 8 percent, and a simple mean treats them as equals, though the second moved 800 units against the first account’s 10, eighty times more absolute movement.
No error or misrepresentation is needed: every percentage can be accurate and the aggregate still misleading.
A hypothetical worked example
The four accounts below are hypothetical, invented for this article, and describe no agency, campaign, or case study in this library. In this hypothetical portfolio, Account A moves from 20 to 30, a 50 percent change. Account B moves from 15 to 21, a 40 percent change. Account C moves from 10,000 to 10,800, an 8 percent change. Account D moves from 8,000 to 8,640, also 8 percent.
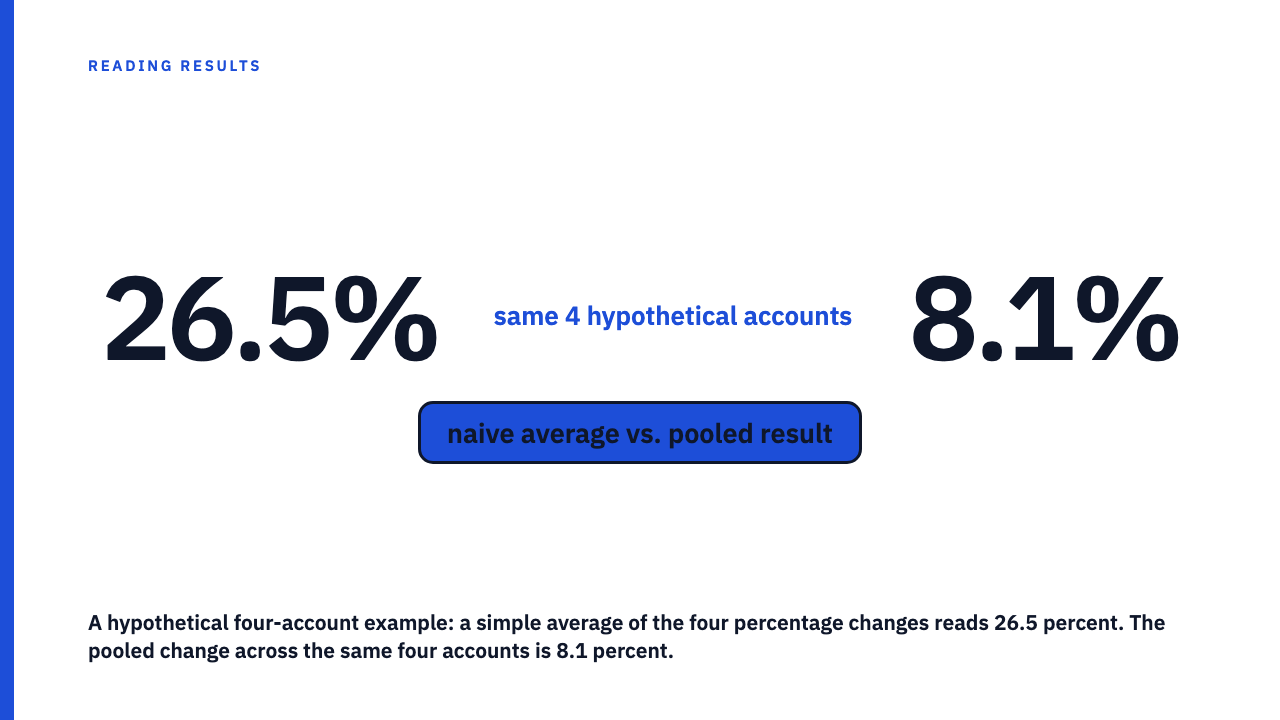
The simple average of those percentages is (50 + 40 + 8 + 8) divided by 4, which is 26.5 percent. That is the number that goes on the results page.
Now pool it. The four baselines add to 18,035 units, the four after-values to 19,491. The combined change is (19,491 minus 18,035) divided by 18,035, roughly 8.1 percent. Same hypothetical accounts, same accurate percentages, and the portfolio-wide figure is under a third of the reported average.
Look at where the base sits. Accounts A and B hold 35 of the 18,035 baseline units between them, about 0.2 percent of everything measured, yet they supply 90 of the 106 percentage points being summed and half of the four equal weights.
Side by side: what each account actually contributed
| Account | Baseline | After | Percentage change | Share of total baseline |
|---|---|---|---|---|
| A (hypothetical) | 20 | 30 | 50% | 0.1% |
| B (hypothetical) | 15 | 21 | 40% | 0.1% |
| C (hypothetical) | 10,000 | 10,800 | 8% | 55.4% |
| D (hypothetical) | 8,000 | 8,640 | 8% | 44.4% |
| Total | 18,035 | 19,491 | 8.1% pooled | 100% |
Naive average of the four percentages: 26.5 percent. Pooled change across the same four hypothetical accounts: 8.1 percent.
What a pooled or weighted figure actually controls for
A pooled figure treats the portfolio as one measurement: add all the before numbers, add all the after numbers, calculate one change. An account with a bigger baseline, in spend, followers, revenue, or conversions, then carries proportionally more influence, because it is proportionally more of what is measured.
A weighted average gets there from the other side: weight each percentage by its own baseline, then average. Above, that also gives 8.1 percent, and both differ from a simple mean unless the accounts share a baseline size.
This is a relative of Simpson’s paradox, not the same thing. That paradox is a trend reversing under aggregation. Here the direction holds and only the size inflates, and both come from ignoring group size.
What to ask when a portfolio number is reported as an average
- Average of percentages, or pooled result? Average alone does not say. Treat it as unresolved until someone names the calculation.
- How many accounts, and are their sizes disclosed? Without a count and a size distribution, nobody can check it.
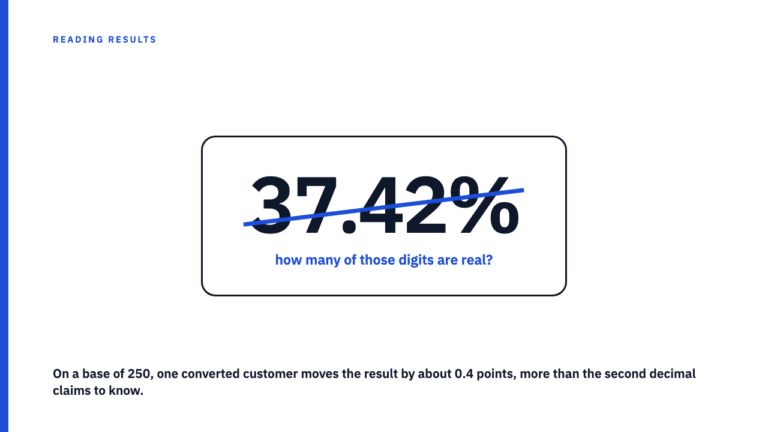
- Could a few small accounts be carrying it? Small bases make big percentages, which is why when the base is small, the percentage is mostly noise.
- What is the base unit? Pooled followers, spend, and revenue are three different answers, and percentage increases and percentage points are not the same claim either.
This is not the same trap as one outlier account
You could read this as a story about one outlier account skewing a portfolio average, but there is no outlier above. A 50 percent move on a base of 20 is unremarkable, and so is 8 percent on 10,000. Every result looks modest alone, and the aggregate still lands three times too high.
So dropping the best account does not fix it. Remove Account A and the naive average of the remaining three is still about 18.7 percent against a pooled 8 percent. The distortion is in the method, not in any account’s result.
Read more results claims like this one
Every case study here is published by the agency behind it, with the numbers stated as theirs. Browse the case study library or submit your own.
FAQ
Is averaging percentages across accounts always wrong?
No. When accounts are similar in size, a simple mean of their percentage changes is a fair summary. It misleads when baselines vary widely, since a tiny account’s swing carries the weight of a large one’s.
What is a pooled or weighted average lift?
It combines every account’s before and after numbers into one total change, so the portfolio is measured once instead of summarised as a list of ratios. Equivalently, weight each account’s percentage change by its own baseline before averaging, which lands on the same figure. Either way, the result reflects how much of the combined outcome each account actually represents.
Does a pooled figure just let the biggest account dominate the story?
Yes, by design, and that is the point. The largest accounts hold most of the baseline being measured, so a figure describing the whole portfolio should be dominated by where the portfolio’s activity actually sits. A method that lets a 20 unit account move the headline as much as a 10,000 unit account is describing a list, not a portfolio.
How can I tell whether a published average is a simple mean or a pooled figure?
Look at the wording. “Average across our clients” suggests a mean of percentages, “combined” or “aggregate” suggests pooling. Treat an unqualified “average X percent” as unclarified until someone names the calculation.
Sources
- Simpson’s paradox, Wikipedia, as a trend that reverses under aggregation. Fetched 2026-09-08.