Share of voice is only as honest as the competitor set behind it
The slide says share of voice rose, next to an arrow. The arithmetic is probably right. What it was performed on is a set of choices made before measuring began.
What a share of voice number is actually a ratio of
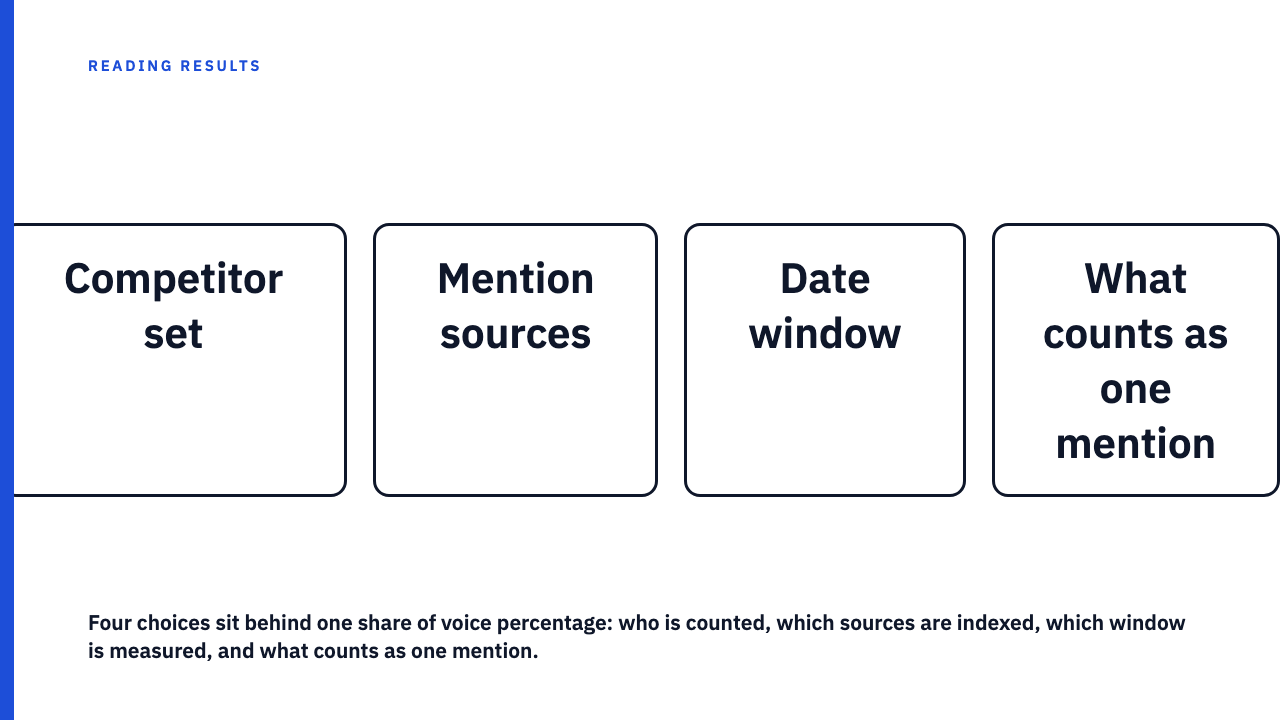
Share of voice is the brand’s mentions divided by the combined mentions of the brand and a chosen set of other brands, over a chosen period, from a chosen set of sources. The metric supplies the division. Every input is selected, the same problem as engagement rate is three different metrics wearing one name, with a bigger denominator.
Share of voice counts mentions. Share of search reads search interest in brand terms. Two different measurements, often filed under one heading. Vendor scope differs too: Sprout Social keeps media share of voice outside its social figure, Brandwatch folds organic search, paid impressions, social and press into one number.
The competitor set is a decision, not a fact about the market
A set gets drawn three ways: the client names the rivals it worries about, a tool suggests one, or it already exists from an earlier project. Brandwatch’s own process starts by identifying competitors and compiling the keyword list, so the set is configured. Add a high-volume competitor and the brand’s share falls with nothing else changing. Drop one and it rises.
Narrowing to one product category or region can be legitimate. The problem is an undisclosed choice, not the narrowing. A disclosed set names the brands, states the count, and says why that set and not a wider one.
A worked example, with hypothetical numbers
This example is hypothetical, and the brand’s mention count is identical in both versions, so its own activity never changes. In a hypothetical set of four brands, 4,000 divided by 20,000 is 20.0 percent, then 5,000 divided by 21,000 is 23.8 percent, a gain of 3.8 percentage points. Add one large national competitor of far higher volume and the same hypothetical quarters give 4,000 divided by 40,000, then 5,000 divided by 51,000. Flat, and fractionally down.
All figures hypothetical.
| Version | Brand | Others | Total | Share |
|---|---|---|---|---|
| Four brands, Q1 | 4,000 | 16,000 | 20,000 | 20.0% |
| Four brands, Q2 | 5,000 | 16,000 | 21,000 | 23.8% |
| Five brands, Q1 | 4,000 | 36,000 | 40,000 | 10.0% |
| Five brands, Q2 | 5,000 | 46,000 | 51,000 | 9.8% |
The honest sentence for that hypothetical pair is “share of voice rose within this set of four brands,” not “share of voice rose.”
Where the mentions came from is the second hidden choice
The sources and the query are a separate lever:
- Which surfaces were indexed, and whether the tool holds permitted access to each. YouTube’s Data API requires registered credentials and meters use by quota, so coverage follows platform terms.
- The query: which spellings, handles, hashtags and product names counted, and whether the brand got its misspellings while rivals got exact names only.
- Language and geography filters, applied to every brand or only to one.
- Owned and paid content: whether the brand’s posts, employees’ posts and paid placements counted.
- One post as one mention, or one mention plus every reply and quote.
Share of search looks more objective than it is
A Google Trends line looks like a volume chart and is not one. Google’s documentation states that Trends uses a sample of search requests, divides each point by total searches for its geography and time range, and scales the result from 0 to 100 against a topic’s proportion of all searches.
The comparison is built too. Google’s page on comparing terms notes that you enter groups of terms alongside each other, and that a term excludes misspellings, synonyms and plurals. A brand term rising beside two rivals can flatten when a third and larger rival joins.
What to ask before you accept a reported gain
This pairs with the before picture is also a choice: a set can change between periods.
| Ask | An acceptable answer sounds like |
|---|---|
| Which brands, how many, chosen by whom? | “Four, listed in the appendix, agreed before measurement ran.” |
| Identical set before and after? | “The same four in both windows.” |
| Which sources and query, and the same for every brand? | “These surfaces, this query string, spelling variants listed for every brand.” |
| Which date ranges, and does either hold a rival’s campaign or quiet spell? | “April to June against January to March, and one rival launched nationally in the later window.” |
| Percentage points, or a percentage increase? | “Up 3.8 points, from 20.0 to 23.8,” a different claim from “up 19 percent.” |
When the number is worth something
Informative when the set was fixed in advance, sources and query were identical across brands, the windows match, and the raw counts sit beside the percentage. Even then it is competitive context and not an outcome, so a clean gain is not evidence of revenue or preference, and a share from one set does not transfer, which is why someone else’s result is not your benchmark. Ask for the counts and the brand list, not the percentage.
Read these claims side by side
Browse the case study library, or start with how to read a marketing case study, then submit your own.
FAQ
How is share of voice calculated?
The brand’s mentions divided by the combined mentions of the brand and a chosen set of other brands, as a percentage. Three inputs are chosen rather than given: the set, the sources and query, and the window.
Is share of voice the same as share of search?
No. Share of voice counts mentions inside a chosen source set. Share of search reads search interest in brand terms, and the comparison terms are chosen the way a competitor set is. Google’s documentation describes Trends values as sampled and scaled from 0 to 100 rather than counted.
Does a share of voice increase mean a campaign worked?
Only if the set, sources and windows held constant across both periods. A rise can come from a rival going quiet, and the metric is competitive context rather than outcome.
What should a case study disclose about its share of voice number?
The named brands, how many, the sources and query behind the counts, the exact date ranges, and the raw mention counts beside the percentage. A percentage with none of that attached is not checkable.
Sources
- Google, Trends data FAQ. Fetched 2026-09-08.
- Google, comparing Trends terms. Fetched 2026-09-08.
- Sprout Social, share of voice. Fetched 2026-09-08.
- Brandwatch, share of voice. Fetched 2026-09-08.
- Google, YouTube Data API. Fetched 2026-09-08.