What a case study leaves out when it names the winning variant
A case study names the winning variant and the percentage it beat the control by, and the implicit invitation is to make the same change. Before you do, ask what the report would need to say for that number to mean anything.
The percentage is the least informative number in the report
A reported lift cannot be checked against anything. It is a ratio between two numbers you have not been shown, so it fits a careful experiment and a broken one equally. The same figure survives a six week test across tens of thousands of sessions and one called on a Tuesday afternoon because the line looked good.
Four facts would separate them: how long it ran, how many conversions each arm collected, whether the result was evaluated once at a preset point or watched until it looked favourable, and how many variants ran before one won. You are reading a finished report, not designing a test. Start with how to read a marketing case study.
What “duration” is actually doing in a test result
Start and end dates do more work than they look. A test that ran across a single day, or one day of the week, inherited whatever else happened then: a promotional email, a sale, an outage that suppressed one referrer.
Then the novelty effect. A new layout can win because it differs from what returning visitors have learned to ignore, and that advantage decays. A brief test cannot separate a durable improvement from a reaction to change.
A result reported with no dates has withheld the one fact that would let you judge whether either problem applies.
A hypothetical lift, and the two numbers that decide if it means anything
The example below is hypothetical. The numbers are invented for illustration and come from no real test.
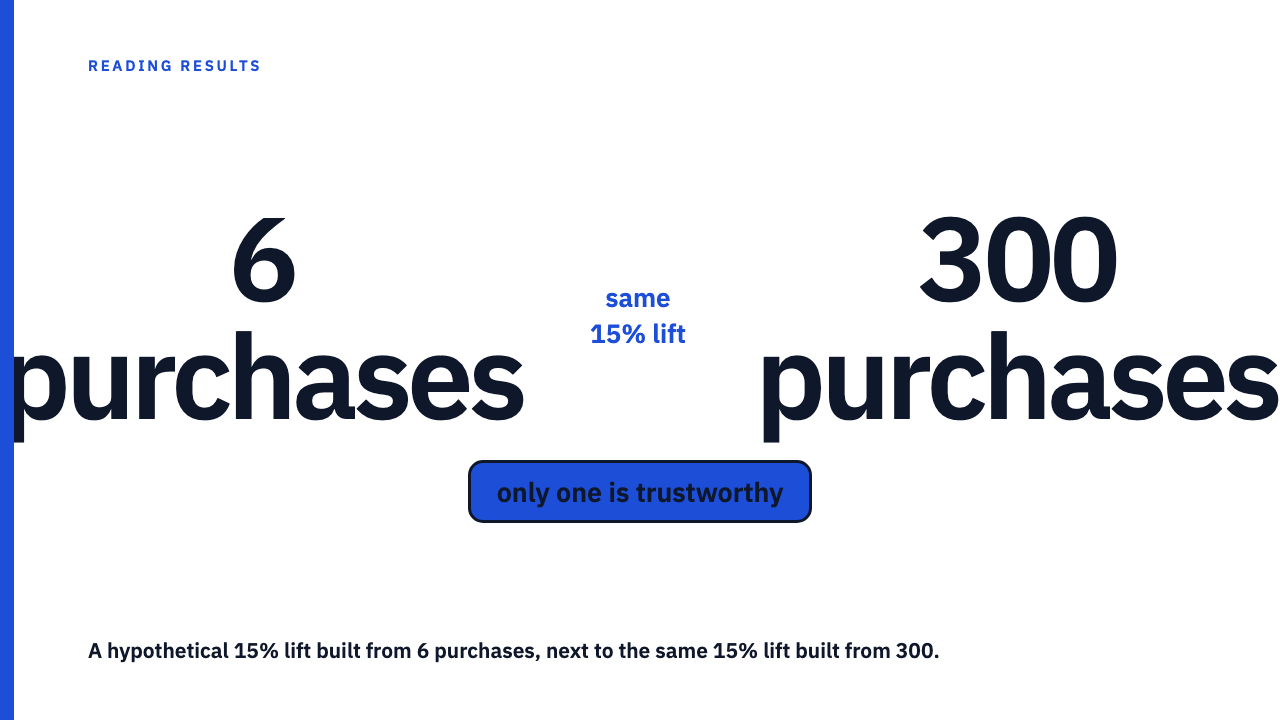
A hypothetical headline: “New checkout button lifted conversions 15%.” One way that is true: control, 1,000 visitors and 40 purchases, a 4.0% rate; variant, 1,000 visitors and 46 purchases, a 4.6% rate. A correctly calculated 15% lift whose entire substance is six purchases.
Another way the same hypothetical headline is true: control 50,000 visitors and 2,000 purchases, variant 50,000 and 2,300. Same rates, same lift, three hundred extra purchases behind it instead of six. Only the second is close to trustworthy, and the headline is identical.
The confidence interval formalises this: a range of plausible values for the true effect rather than a single point estimate. With small counts that range includes zero and a decline, meaning the lift sits inside what chance alone produces. No universal threshold is worth memorising, since the volume needed depends on the baseline rate and the effect size. Check whether per-arm numbers appear at all, as in when the base is small, the percentage is just noise.
Checking the scoreboard changes the scoreboard
Peeking is watching a live test on a dashboard and calling it the moment the gap looks favourable. It feels responsible. It is the opposite.
The gap between arms drifts constantly as data accumulates. If you may stop whenever it favours your variant, some moment will arrive in almost any test when it does, whether or not the variant works. The formal name is data dredging, many looks with only the significant ones reported, inflating the false positive rate past the stated confidence.
A case study almost never says which happened. An endpoint fixed in advance and a test watched until it looked good read identically, so you usually cannot tell.
The variants that did not win are also data
Run a control against eight variants at once. Even if all eight do nothing, each carries its own chance of a false positive, and the odds that one pulls ahead climb with every arm. This is the multiple comparisons problem, and it is why “we tested nine things and one worked” is weaker than “we tested one thing and it worked.”
A report built to showcase a win has no incentive to mention the eight that lost, so the survivor appears as the only thing tried.
That is peeking in another dimension: many looks over time, or many looks across variants, with the flattering one published. An A/B test compares a control against one or more variants, and that control is a built-in counterfactual, unlike the counterfactual a case study can’t show you.
What case studies report versus what they withhold
| What the report could tell you | How often it does, qualitatively |
|---|---|
| Which variant won, and the reported lift | Almost always present |
| Test duration, meaning actual start and end dates | Commonly absent |
| Per-arm sample size or conversion counts | Commonly absent |
| Whether the result was evaluated once at a preset endpoint or stopped early | Almost never disclosed |
| How many variants were tested, and what became of the losers | Rarely disclosed |
Those are qualitative descriptions, not measured frequencies.
Questions to ask before you copy the change
- How long did it run? Does the window cover a full week, and does it overlap a sale, a campaign burst, or a platform change?
- How many conversions did each arm collect? Not the lift, the counts.
- Was the endpoint fixed in advance? Look for a statement that sample size or end date was set before launch.
- How many variants ran, and are the ones that lost mentioned anywhere?
The list sorts claims, it does not reject them. Answer all four and you have a finding. Answer none and you have a direction worth testing against your own baseline.
Read a few, then read yours
Browse the case study library, where every result is credited to the agency that reported it, or submit your own.
FAQ
If a case study reports a percentage lift, isn’t that enough to know the test worked?
No. A lift is a ratio between two numbers the report has not shown you. Without duration, per-arm counts, and some sign of how the result was evaluated, it could reflect a durable effect or a few days of noise.
How much sample size does an A/B test need before its result is trustworthy?
There is no single number. The volume required depends on the baseline conversion rate and on how small an effect you want to detect. Your job as a reader is to check whether per-arm volume is disclosed at all.
Sources
- A/B testing, Wikipedia, fetched 5 September 2026
- Confidence interval, Wikipedia, fetched 5 September 2026
- Data dredging, Wikipedia, fetched 5 September 2026
- Multiple comparisons problem, Wikipedia, fetched 5 September 2026