Three Calculator Checks to See if a Case Study Reconciles
A case study says it turned $12,000 of spend into $90,000 of revenue, and the result looks almost too tidy to repeat. You need only the printed figures and a calculator to test it.
Why the numbers a case study omits matter more than the ones it prints
Every headline figure implies others the report never states. A report that gives spend, visits and revenue has also, by arithmetic, given a conversion rate, a cost per order and a revenue per order, whether or not it printed them.
This method cannot prove a result true. It can only show that a report is internally inconsistent or depends on a figure it did not disclose. Passing means “not contradicted”, never “confirmed”. You want the claim to be true, and you check anyway.
The hypothetical case we will test
Everything below is a hypothetical case study summary. No agency, client or brand is meant. The figures are invented for arithmetic practice and are not a benchmark of any kind.
| Input | Hypothetical figure |
|---|---|
| Spend | $12,000 |
| Attributed revenue | $90,000 (headline: “a 7.5x return”) |
| Visits from social | 30,000 |
| Orders | 1,800 |
| Followers at end of campaign | 25,000 |
| Stated product price range | $25 to $40 |
| Stated gross margin | 40 percent |
These are the only inputs we use. Each is something a real case study might print, and none is claimed to be typical.
Check one: the implied conversion rate
Divide orders by visits: 1,800 / 30,000 = 0.06, so 6 percent.
Compare it to the report’s own other claims, and to which of the five different funnel stages the report means by “conversion”. Then check that orders and visits count the same unit: sessions or users, orders or purchasers.
A flag is not “the rate is high”. It is “the rate is high and the report offers no reason”, such as a warm email list or a discount it never mentions. A surprising rate is a question to ask, not a verdict.
Now the denominator trap. Suppose the 30,000 visits are social-referred only, but the 1,800 orders are all-channel. Then 6 percent mixes two populations. Hypothetically, with 900 social-attributed orders, 900 / 30,000 = 0.03, or 3 percent.
Check two: cost per order, revenue per order, and the margin they leave
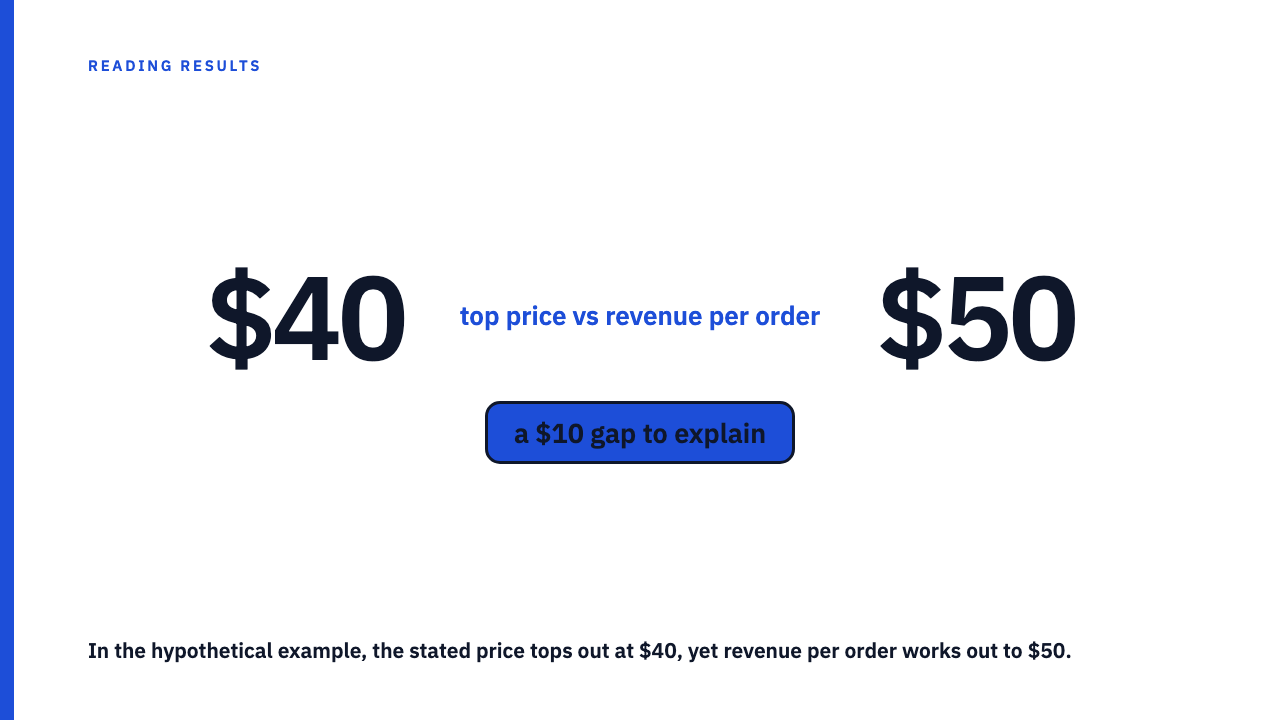
Spend per order: $12,000 / 1,800 = about $6.67. Revenue per order: $90,000 / 1,800 = $50.
Here is the reconciliation failure built into the example. The stated price range tops out at $40, yet revenue per order is $50. Three honest explanations exist: bundles or upsells, shipping included in revenue, or orders from outside the campaign in the count. The report should say which. None is damning, but the gap must be explained.
Now margin. At 40 percent, $50 of revenue leaves $20 of gross margin ($50 x 0.40), so $6.67 of spend looks comfortable. At the $40 price ceiling the margin is $16 ($40 x 0.40). The cushion over $6.67 shrinks from $13.33 to $9.33 per order, depending entirely on the unexplained $10. The wider point, that a return multiple is not profit, is covered elsewhere.
The 7.5x headline is simply $90,000 / $12,000. It adds no information beyond the two numbers behind it, and it passes or fails exactly as they do.
Check three: the implied share of the audience
Divide the outcome by the pool it must have come from. 1,800 / 25,000 = 0.072, or 7.2 percent of followers, if every buyer were a follower and bought once. This is a ceiling test, not an estimate.
If the share is above 100 percent, the buyers must have come from outside the pool, so the pool is the wrong denominator and the report should name the real one. If it is small, the check passes quietly and tells you little.
A quick variant, still hypothetical: suppose the case study claimed 18,000 orders from the same 25,000 followers. 18,000 / 25,000 = 0.72, or 72 percent. Ask where the other buyers came from. Paid reach, search and repeat purchasers counted per order are candidates.
This suits some claims, such as orders, sign-ups and downloads. It does not suit impressions, which have no natural ceiling in followers.
What to do when a check fails, and when it cannot be run
A mismatch is an unanswered question, not proof of dishonesty. A good one-line question to the source: “Does the order count include orders from outside the campaign, and does revenue include shipping?”
Sometimes the check cannot be run, because the report gives only a percentage or only one of the needed figures. That tells you how much the report discloses. Compare a report with no stated duration or a case study with no numbers.
Work in this sequence: spend, outcome count, outcome value, audience or traffic. With three of the four you can derive the fourth and compare it with what is printed. For the qualitative side, see how to read a case study. The library credits every number to the agency that reported it, so a failed check is a question for that agency, never a statement about the library.
A two-minute routine to keep
- Conversion: orders / visits, confirming both count the same unit and channels.
- Value: revenue / orders, set against the stated price, then multiplied by the stated margin.
- Reach: outcome / audience, flagging anything near or above 100 percent.
A pass means the numbers are not contradicted by each other. It does not mean they are verified.
Practise on published work
Browse the case study library and run the three checks on published work. If you have a case study whose numbers reconcile, you can put it forward via the submissions page.
FAQ
Can arithmetic prove a case study is accurate?
No. It can show inconsistency or an undisclosed dependency, but a pass only means the figures are not contradicted by each other.
What if the case study only gives percentages?
The checks need some absolute figures, so say the check cannot be run and treat that as a disclosure gap, much like multiplier claims that hide the base.
Is a very high implied conversion rate always a red flag?
No. It is a prompt to ask about audience warmth, offers, and what counts as a visit or an order.
What should I do if the numbers do not reconcile?
Ask the source one specific question about which population or definition each figure covers, before concluding anything.