Up 50 percent, then down 50 percent, is not break even
A case study says the account saw “average growth of 15 percent per quarter” over a year. Did it end up where that implies? Every number below is a hypothetical worked example, not a reported result from any agency or from this library.
Start at 100, gain half, lose half
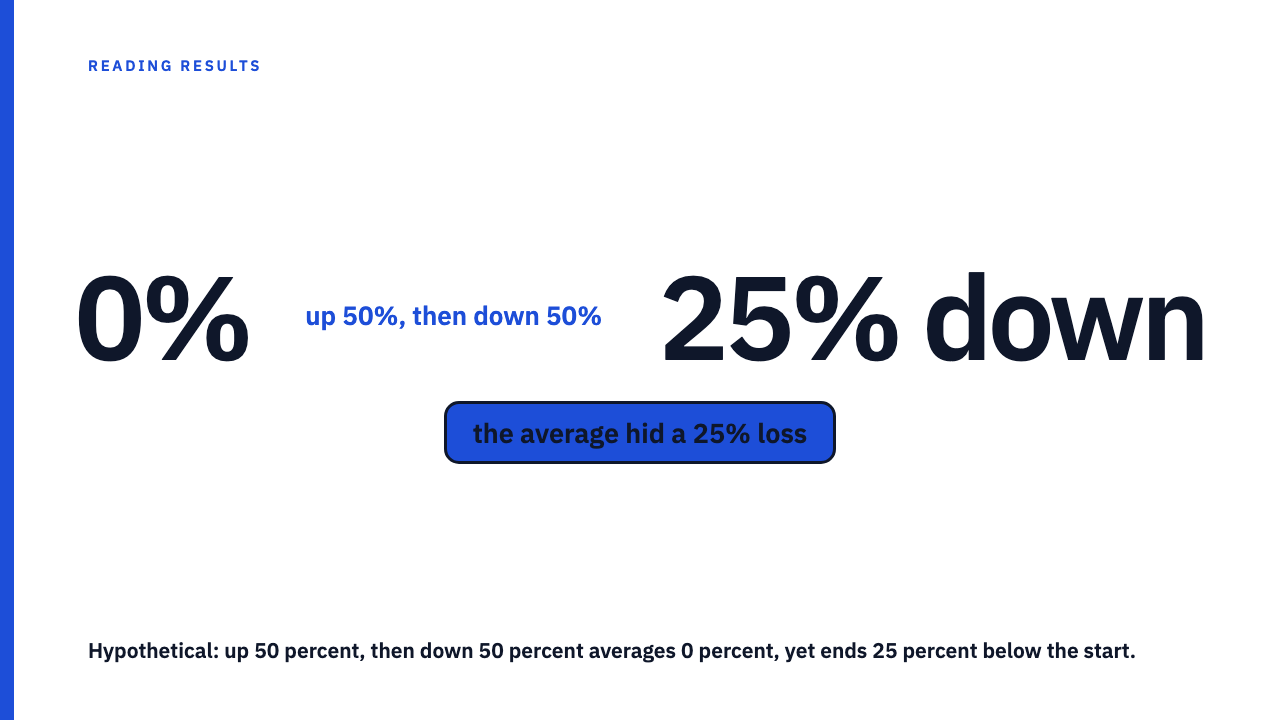
Hypothetical: a metric sits at 100. It rises 50 percent to 150, then falls 50 percent to 75. The average of +50 and -50 is 0, yet it finished 25 percent below its start.
The reason: the second percentage is applied to a bigger base than the first, so the loss is worth more units than the gain was.
A positive average can mislead too. Hypothetical again: up 60 percent, then down 50 percent averages +5 percent, but 100 becomes 160 and then 80, down 20 percent. A report of “average quarterly growth of 0 percent” would be literally true for the first pair and still hide a 25 percent loss.
Two averages that answer two different questions
Percentage changes multiply, they do not add, because each change is applied to the previous period’s ending value. The arithmetic mean answers “what was a typical single-period change?” The geometric mean answers “what one constant rate per period would have carried the start to the end?” That is what readers usually mean by “average growth”.
On the 50/50 case, convert each change to a growth factor, 1.5 for up 50 percent and 0.5 for down 50 percent. Multiply to get 0.75, take the square root for two periods, about 0.866, and subtract 1. That is about down 13.4 percent per period. Use the factors, not the raw percentages, since one is negative.
The shortcut needs only the start value, end value and number of periods, n: (end / start) raised to 1/n, minus 1. In business this is the compound annual growth rate, or CAGR. Wikipedia’s geometric mean article describes the geometric mean as more appropriate for proportional growth, and its CAGR article notes that CAGR smooths volatility that can make arithmetic means less meaningful.
The arithmetic mean is not wrong in itself. It suits a typical single period, or periods each measured against a fresh baseline. It misleads when presented as growth over the whole span.
A four-quarter case study, worked both ways
Hypothetical: a made-up account tracks qualified leads per quarter.
| Quarter | Change | Ending value |
|---|---|---|
| Start | none | 1,000 |
| Q1 | up 40 percent | 1,400 |
| Q2 | up 10 percent | 1,540 |
| Q3 | down 20 percent | 1,232 |
| Q4 | up 30 percent | about 1,602 |
The arithmetic mean of the four changes is 15 percent per quarter. The geometric mean is about 12.5 percent. Total growth is about 60 percent.
Now the back-test. Grow 1,000 at 15 percent for four quarters and you reach about 1,749, or 74.9 percent total growth. The series reached about 1,602, so a headline of “average 15 percent quarterly growth” overstates the outcome by roughly 147 units. At 12.5 percent, 1,000 lands on about 1,602.
The series has real growth in it. The quoted average is just bigger than what it earned.
The more the quarters swing, the wider the gap
When every period has the same percentage change, the two averages are identical. The gap opens as the periods diverge. The geometric mean never exceeds the arithmetic mean, per the inequality of arithmetic and geometric means, with equality only when all values are equal. So the arithmetic figure is the flattering one, or level.
An exaggerated hypothetical: up 100 percent, then down 50 percent. The arithmetic average is +25 percent per period, but 1,000 becomes 2,000 and then 1,000. The true result is flat, and the geometric mean is 0 percent.
Recovery is asymmetric. A fall of 50 percent needs a rise of 100 percent to get back, and a fall of 20 percent needs a rise of 25 percent. A loss in percent is always smaller than the gain that undoes it, another case where a percentage only means something once you know its base.
This bites on a launch spike followed by a fade, or a seasonal pattern with one strong quarter and one weak one. Steady quarters show a small gap. Lumpy ones show a large one.
What to do when a case study quotes an average growth rate
- Find the start value, end value and number of periods. If the study gives only percentages, the average cannot be checked from the page, so treat it as unverified.
- Compute (end / start) raised to 1/n, minus 1, and compare. A clearly higher quoted figure is probably an arithmetic mean of period changes.
- If period changes are listed, multiply the growth factors through and see whether the total matches the reported end value.
- Check the periods are equal in length. An average monthly figure over eight months is not an annual one, and a cumulative total and a rate are different claims.
- Ask what the average is of. Period-on-period and year-on-year changes for the same quarter answer different questions, and the answer changes which comparison is honest.
What the right average still leaves open
A correct compound rate describes what happened, not what caused it. Baseline, attribution and outside events are separate questions. The endpoints matter too: a series that begins just after a dip, or ends at a peak, gives a flattering geometric mean as well. The reporting window is itself a choice. Averaging across accounts at one moment is a different problem from averaging across time for one account; see how one outlier account can skew an average.
You can now rebuild the end number from the average. A study that will not let you has told you something too.
Check a study yourself
Browse the case study library and try the back-test on any study quoting an average. Or submit your own.
FAQ
How do I calculate the geometric mean of growth rates?
Convert each change to a growth factor, multiply them, take the nth root for n periods, then subtract 1. Or use start, end and periods directly. In the hypothetical above, 1,000 growing to about 1,602 over four quarters gives about 12.5 percent per quarter.
What if the case study gives only the average and nothing else?
Then it cannot be checked from the page, so treat it as unverified. You need the start value, end value, and the number and length of periods.
Sources
- Geometric mean, fetched 2026-09-21
- Compound annual growth rate, fetched 2026-09-21
- Inequality of arithmetic and geometric means, fetched 2026-09-21