An index of 140 means nothing until you know what equals 100
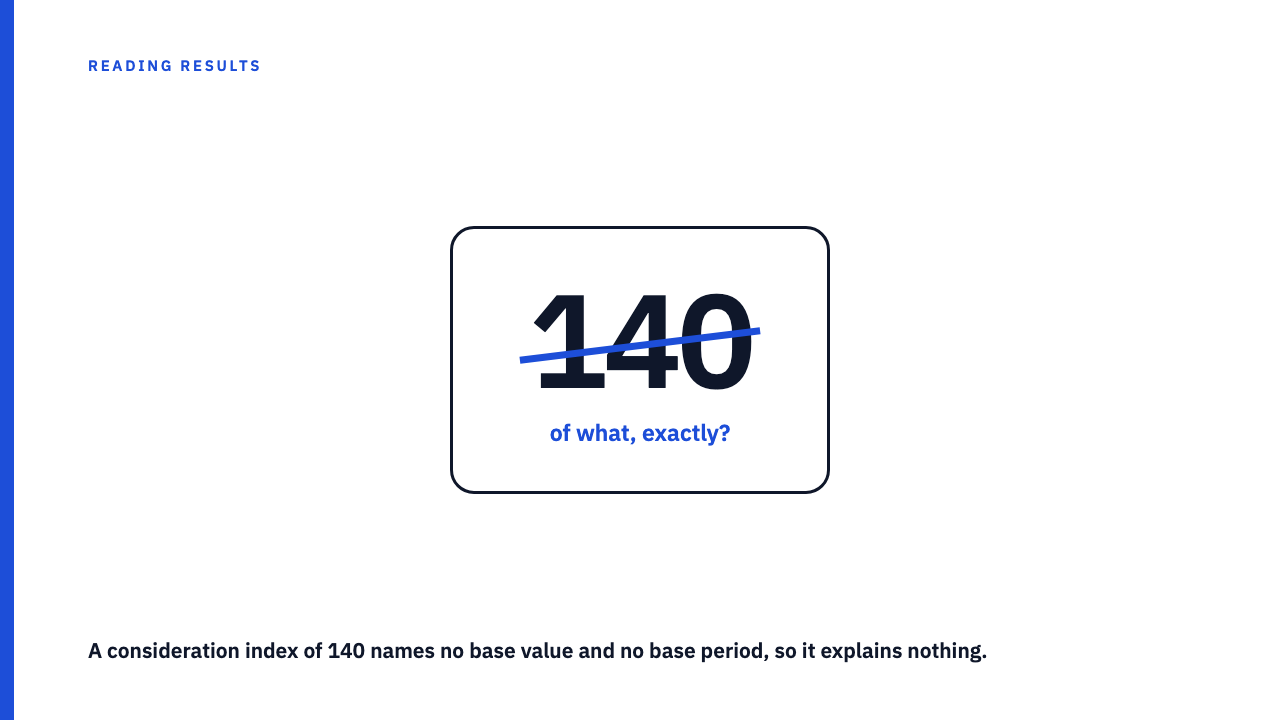
A results deck slides up a single clean figure. Consideration index: 140. It reads like a verdict, and it is meant to. But a number like that is only half a sentence. It says a value sits above a reference point, and nothing about what that point was or when it was measured. Until the deck names both, a 140 is not a strong result or a weak one. It is not readable at all.
What an index actually is
An index number takes one chosen value, sets it equal to 100, and expresses every other value relative to that point. Eurostat’s glossary puts it plainly: the index reflects only the change compared with the value in a reference period, and for simplicity that reference value is set to 100. An index of 110 then means a 10 percent increase over the reference period.
The base is a choice, not a fact of the data. Someone decided which moment, group, or figure would be called 100. So before an index means anything, a reader needs two things it never carries on its face: what was set to 100, the base value, and when that base was measured, the base period. The number shows neither, which is why it travels so well through a slide deck. It looks like a finding while leaving its two most important disclosures behind.
Why an unanchored index is a percentage in disguise
Strip away the vocabulary and an index is a percentage change wearing a nicer suit. An index of 138 against a base of 100 is arithmetically a 38 percent change from whatever the base measured. Nothing more. It inherits every weakness of a bare percentage, chief among them that a percentage with no absolute base can describe a rounding error or a landslide. Thirty-eight percent of a number you cannot see could be three units or three million, and an index hides that absolute base by design.
Consider a hypothetical worked example. A deck reports a brand consideration index of 138 for the campaign period, with no line stating what was measured, on whom, or in which month. Was 100 a survey of two hundred people or twenty thousand, the month before launch or a year earlier in a slow season? The 138 is identical in all these cases and means something different in each. The figure is invented purely to illustrate the point, and it is not a reported result belonging to any brand or agency.
The base period is where the number is really set
Because the base is chosen, moving it changes the headline while the underlying data stays the same. This is rebasing, the quiet lever behind a lot of impressive-looking indices. The Wikipedia entry on economic indices describes the same issue: indices rely on fixed assumptions, such as a set reference basket, and those assumptions shape what the index reports across periods.
Set a low base period, a quiet month with weak interest, to 100 and later values tower over it, because they are measured against a deliberately small starting point. Set a high base, a peak moment, and the same values look flat. The data did not move. Only the choice of 100 moved. A base can also be a group rather than a moment: a control set, a category average, or a launch cohort, each hiding a different assumption about whether the reference was fair. So the reader’s move is narrow. Ask what the 100 was measured on and when, and treat an index whose base is undisclosed as unreadable rather than merely imperfect.
You cannot compare two indices with different bases
This is the rule that gets broken most often, usually in a summary slide lining up several campaigns.
- An index of 140 on one base and 120 on another are not rankable. They are measured against different 100s, so the higher number is not the better result. It is a larger multiple of a different, unstated thing.
- The refusal is concrete. Do not let two indexed numbers sit in the same comparison until both base values and both base dates are on the table. If either is missing, the comparison is not merely close. It is impossible to make.
- This differs from an honest use of an index. A disciplined analyst discloses the base, keeps it fixed across the numbers compared, and does not ask you to rank across bases. The failure is not the index. It is the silent base.
A deck that stacks two differently based indices side by side is inviting a category error. Remember that the baseline is a choice made by whoever wrote the case study. Stacking mismatched indices is the same mistake as comparing results across different baselines.
The questions that make an index readable
Here is the short interrogation to run on any indexed result in a case study or a tracker.
- What was set to 100, in absolute terms? Not “the baseline,” but the actual quantity or score the 100 represents.
- When was the base measured, and is the comparison window the same length as the base window? A quarter against a single week is not a like-for-like move.
- Is the base a fixed point, or does it move between the two numbers being compared? A base that shifts underneath a comparison invalidates it.
- Would restating the result as a raw before-and-after change the impression? If “138” impresses but “from an unstated small number to a slightly larger one” does not, the index was doing the persuading.
Read the whole library the same way
Reading one indexed number honestly is a habit that protects you across a whole deck, and it sits underneath the broader practice of reading a case study without being misled. You can browse the case study library or submit your own if you have work worth showing.
FAQ
What does an index of 140 actually mean?
Arithmetically it is 40 percent above whatever was set to 100. That is all it states with certainty. Without knowing what the 100 measured and when, the 140 carries no readable magnitude, so it could reflect a meaningful lift over a solid baseline or a large multiple of something trivially small.
What is rebasing?
Rebasing is changing the reference point that gets set to 100, whether a different starting month or a different comparison group. Identical underlying data yields different index values under different bases, so a rebased result can look larger or smaller without anything real having changed.
Sources
- Eurostat, Glossary: Index number, fetched 2026-09-14.
- Index (economics), Wikipedia, fetched 2026-09-14.