Why the First Number in a Case Study Shapes How You Read the Rest
You read a case study, scroll past the big number at the top, and reach the figure that applies to your business. It feels small, though nothing about that number changed while you were reading. That reaction is a response to how the page was built, not a judgment you independently reached. This is not about a case study lying to you. It is about what got put first.
The reader who feels let down and cannot say why
A case study opens with a headline result, large and rounded, then only later gives you the number tied to the outcome you care about, usually smaller and messier. It feels like a letdown, even though you have only compared it to the number before it on the same page. For the wider version of this problem, how to read a case study without being misled is the general framework this narrower argument sits inside.
The letdown is not a conclusion about the second number’s quality. It is a side effect of the order the page presented its evidence in. Both numbers can be accurate and honestly reported, and the second can still feel disappointing purely because of what preceded it.
What anchoring actually is
The mechanism has a name outside marketing entirely. Anchoring is a well documented cognitive bias in which an initial piece of information, the anchor, disproportionately shapes the judgments a person makes afterward, even when the anchor has no logical bearing on what is being judged. According to Wikipedia’s entry on the anchoring effect, it was first described in psychophysics, where people compared later stimuli to whichever one they encountered first, later formalised in behavioural economics by Amos Tversky and Daniel Kahneman as a heuristic for estimating under uncertainty. The bias operates the same way even when the anchor is arbitrary, which is why this argument does not require any case study to have been written in bad faith.
A case study page is built in an order, and that order is a choice
Case studies are not assembled in the order a reader would rank the numbers by relevance. They are assembled in the order that makes the page persuasive on a skim. The biggest, most striking figure almost always sits in the headline, the hero pull quote, or the bolded number above the fold, before a reader has decided whether to keep reading. That placement is a normal editorial decision, not a deceptive one: whoever wrote the page chose the number that would make someone stop scrolling. Once ordering is understood as persuasion rather than analysis, position on the page stops being a signal of importance.
A hypothetical case study, read in the order it was built to be read
The following example is entirely hypothetical, drawn from no real agency, company, or reported result.
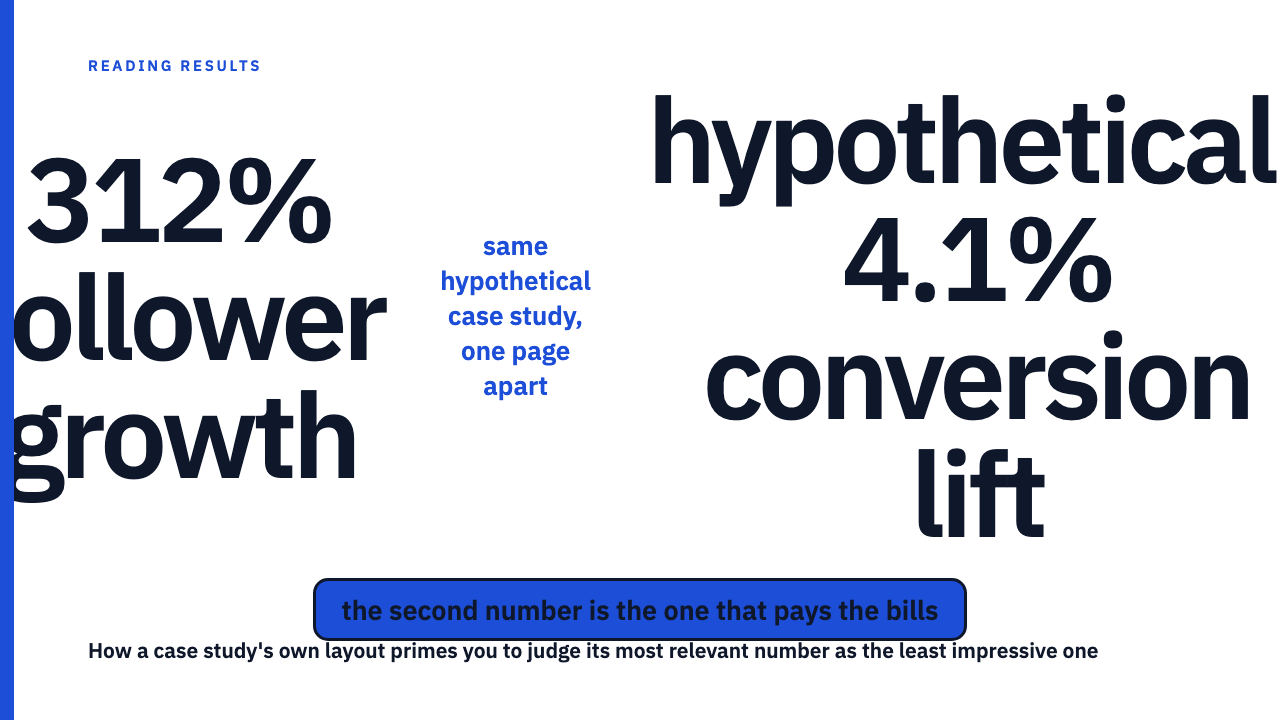
Picture a hypothetical case study whose headline reads: hypothetical, 312% follower growth. That figure sits at the top in large type, the kind of number chosen because it is dramatic and easy to grasp, the sort covered in when the base is small, the percentage is just noise. A reader sees it and forms an impression of a strong result before reading another word.
Further down the same page sits a second figure: hypothetical, a 4.1% conversion lift, the number that actually matters to a reader chasing revenue. By the time they reach it, 312% has already set the scale, and 4.1% looks small next to it, even though it is the number tied to money changing hands. Run that same number alone, with no anchor above it, and it reads as a solid result worth taking seriously. Nothing about the figure changed, only its position.
Why the second number is usually the one that matters more
Headline numbers, follower growth, engagement lifts, multipliers, tend to be chosen because they are large, not because they connect to a business outcome. A number further down is more often tied to something with financial or operational meaning: a conversion rate, a revenue figure, a retention number. The same mechanism is at work when several metrics compete on one dashboard, covered in why the best metric on a dashboard is rarely the real story. This is a pattern in how results pages get built, lead with size, follow with substance, not an accusation against any one case study or agency.
How to read a case study page against its own ordering
- List every number on the page, on its own, stripped of position and size, before forming any opinion about which one is the “real” result.
- For each number, ask: is this the number I actually need, or is it just the biggest one on the page?
- Re-rank by relevance to your own goal, not by page order. A number placed second or third is not weaker evidence for having been placed later.
- Reread the page with that new order in mind. If your sense of the result changes, that shift is the anchoring effect leaving the room.
This is a reading-order problem, not a metric-definition problem
This post is not arguing about whether any specific metric, engagement rate, ROAS, follower growth, is well defined. That is a separate question, covered in how to read a results chart before the caption, which looks at a different presentational mechanism, chart design rather than page order, shaping the same first impression.
Anchoring can happen even when every number on a case study page is accurate and honestly reported. The bias operates on the sequence the numbers appear in, independent of whether any single figure is trustworthy. A page can pass every test of honesty and still lead a reader to underweight the number that matters most, purely by what came first.
Read the next case study with this in mind
The library at Social Case Studies exists so you can practice this kind of reading on real, credited work. Browse the case study library, or if you have a result worth adding to the record, submit your own.
FAQ
Is putting the biggest number first dishonest?
No. By itself it is an ordinary editorial choice, the same one a headline writer makes when picking which fact leads a story. The bias works on a reader whether or not anyone meant to mislead, so the reader has to compensate deliberately.
How can I tell if a number was picked for its size rather than its relevance to me?
Ask what the number would need to be true of for it to matter to your own business. A large lift on a metric you do not track is size without relevance. A smaller number tied to revenue, retention, or conversion is usually the one to weigh more heavily, regardless of where it sits on the page.
Sources
- Anchoring effect, Wikipedia, fetched 2026-09-09