When the Segments and the Headline Number Disagree, Which Is Right?
You are reading a case study and the headline result looks like a clean win. Further down, a table breaks that result out by channel or segment, and the segments disagree with it, sometimes pointing the opposite way. The instinct is to treat that as a mistake, or a sign the headline was massaged. Neither is right.
The chart that seems to argue with itself
The assumption underneath that instinct is reasonable on its face: a truthful case study, the thinking goes, should show the same direction at every level of the data. If the total went up, the pieces that made it up should have gone up too, or at least not all gone down. When a segment table disagrees with the headline, it feels like the report contradicts itself.
That assumption is false. A total and its segments can point in genuinely opposite directions without any error, cherry picking, or dishonesty. The disagreement is sometimes the least suspicious part of the report, because it is what you would expect if the report is actually showing its segment data.
A hypothetical where every segment fell and the total rose anyway
Here is a labelled hypothetical, invented to make the arithmetic clear. It is not a reported result from any agency or case study, and none of these numbers belong to a real campaign.
Picture two channels, Organic and Paid, each with an engagement rate in an earlier period and a later period. Organic went from roughly 2.0 percent to roughly 1.8 percent, a decline. Paid went from roughly 9.0 percent to roughly 8.0 percent, also a decline.
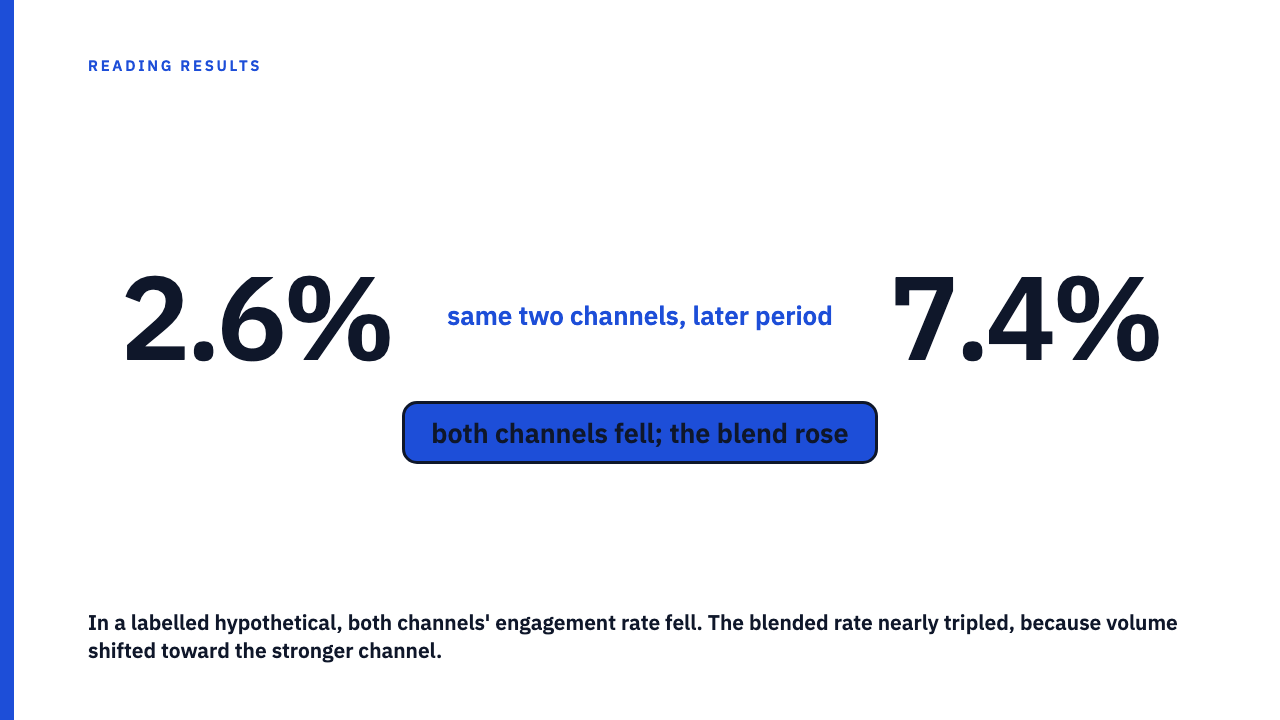
Now look at the blended rate, the number a headline slide would show. In the earlier period, Organic carried the large majority of volume, say 900 units against 100 for Paid, and that mix blends to roughly 2.6 percent. In the later period the mix flips: Paid now carries the large majority, say 900 against 100 for Organic, and that mix blends to roughly 7.4 percent.
Both channels fell. The blend nearly tripled. Nobody made an error or altered a number. What changed was how much of the total activity each channel carried, not how well either performed. Earlier, the weaker channel carried almost none of the volume, so its low rate barely dragged the average down. Later, that channel carried almost all of it, so its rate, though still lower, dominated the mix. The average moved because the weights moved, not because performance did.
Why this is not the same story as a mix shift hiding a decline
This site has already covered a rising total can hide a decline in every segment, and the two arguments are close enough to be worth separating. A mix shift that hides a decline is a case where the total and the segments broadly agree in direction, just by different amounts, because a shift toward a stronger segment softens a decline present everywhere.
Simpson’s paradox is sharper: the direction itself flips depending on whether you look at the total or the parts. It is not that a decline was softened, it is that every segment fell while the total rose. This is the phenomenon in its named form, described on Wikipedia’s page on the topic, a recognised statistical pattern where a trend in combined data can disappear or reverse once split into subgroups.
What has to be true for a reversal like this to happen
- The segments must differ meaningfully in their own rate. If Organic and Paid performed nearly identically, no volume shift could move the blend far.
- The share of total volume each segment carries must shift between periods. Rates alone are not enough; the weighting has to change too.
- Both conditions must hold at once. Either alone produces an ordinary result, not a reversal.
- If segment sizes stayed roughly constant, this reversal cannot happen, no matter how different the rates are. The first thing worth checking is whether volume per segment is disclosed in each period, not just the rate.
What to actually check in the case study you are holding
- Does the case study give a volume or sample size for each segment in both periods? The rate alone cannot tell you whether the weighting changed.
- What aggregation level is being called the “result”? A total, a channel number, and a segment number are three different claims, and the one printed in bold is not automatically the one that matters to you.
- If the total and a segment disagree, that does not mean the case study is dishonest. The aggregate and the segment answer different questions about the same activity, and a report showing both is doing more work for you, not less.
Get more of this before you read the next case study
For a broader checklist of what to look for before trusting a headline number, how to read a marketing case study without being misled is the general starting point this post slots into. You can browse the case study library, or submit your own.
The aggregate number is not the ground truth the segments failed to match
There is no single “correct” level at which to read a result, only the level that matches the decision you are trying to make. The total and the segment breakdown are the same data answering two different questions: what happened overall, and what happened to one specific slice a reader might be part of. Neither is more true than the other.
Go back to the moment that opened this post: the segment table that seemed to disagree with the headline was not a contradiction to resolve. It was the more specific answer to a more specific question, next to the general answer to a general one.
FAQ
Does a segment reversal like this mean the case study is misleading?
Not by itself. The reversal is a structural feature of weighted averages when both segment size and performance change between periods, and a case study that discloses per-segment volume in both periods gives you more to check, not less. It becomes misleading only if the report hides the segment breakdown or the volume figures needed to see the shift.
How can I tell if a real case study has this problem without redoing the arithmetic myself?
Check whether both periods disclose a volume or sample size for each segment, not just a rate. Without that figure, you cannot tell whether weighting shifted, and the aggregate number should be treated as one specific claim, not a summary of every part.
Sources
- Simpson’s paradox, Wikipedia, fetched 2026-09-09.