
The Industry Average Has No Source? Treat It as Anonymous
Case studies love an uncited industry average to make their lift look bigger. Here is how to tell a traceable benchmark from a floating number.
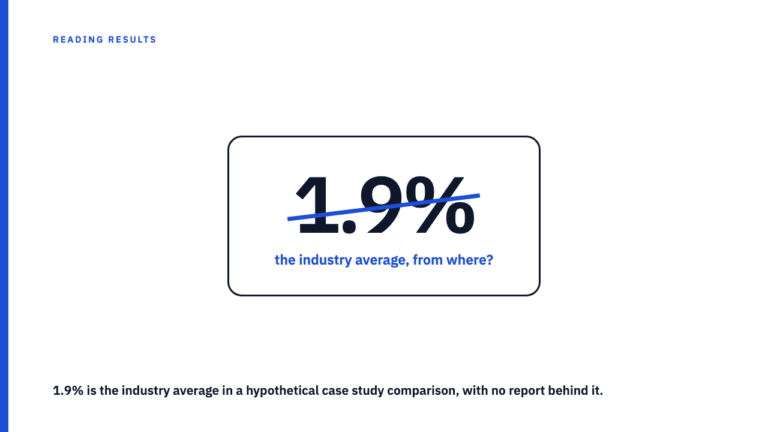
Case studies love an uncited industry average to make their lift look bigger. Here is how to tell a traceable benchmark from a floating number.
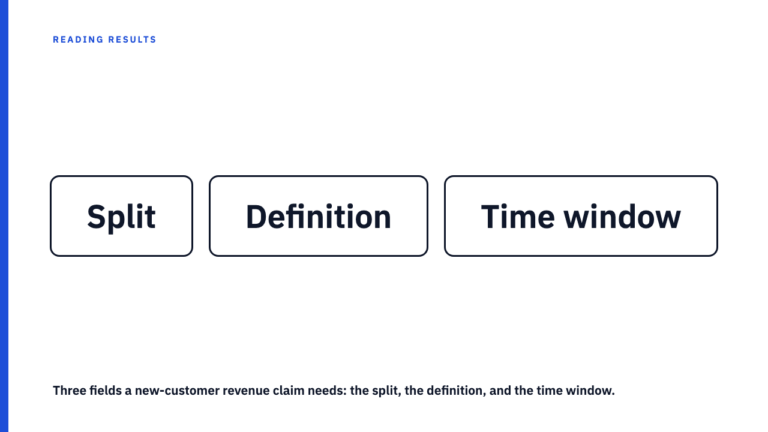
A sales increase during a campaign window can be repeat purchases a retention email was already driving. Here is the split a revenue claim needs to hold up.
Case studies written to win an award follow a judging rubric, not a plain results report. Here is how to read that structure and what it usually leaves out.
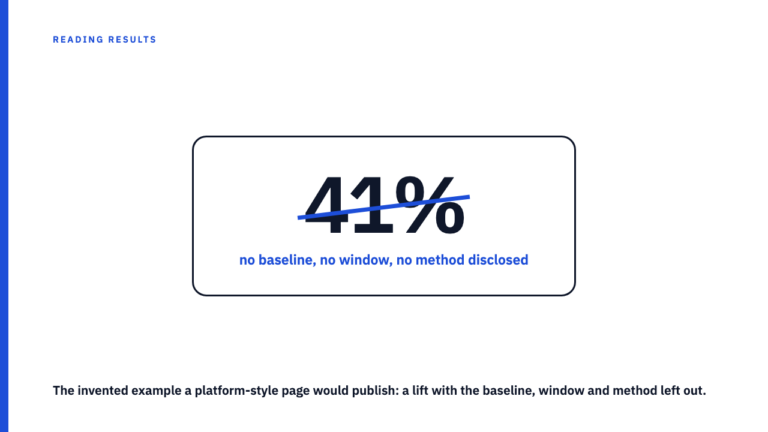
Platform-hosted success stories are written by the team that sells ad inventory. Here is the sharper discount that format actually earns.
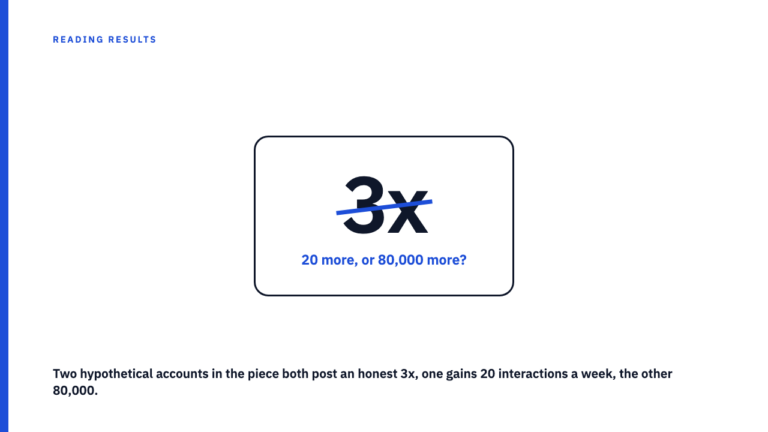
A ‘3x’ or ’10x’ claim is a ratio, not a result. See why multiplier phrasing hides more than a percentage, and the questions that recover the missing numbers.
A before number inflated by bought followers or a giveaway is not a clean baseline. Here is how to spot the contamination before trusting the growth rate.
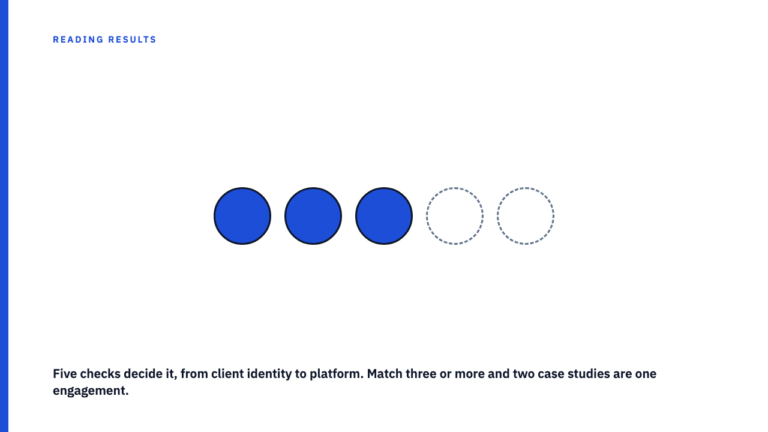
A client win can surface on an agency’s own site, in an awards entry, and in a directory listing. Learn to spot when three studies are one engagement.
A case study can state a sales goal, then close by reporting a follower count instead, with no explanation of how the second number produced the first.
A big all-time number under a named campaign proves nothing about that campaign. Here is how to spot the swap and what a bounded number looks like.
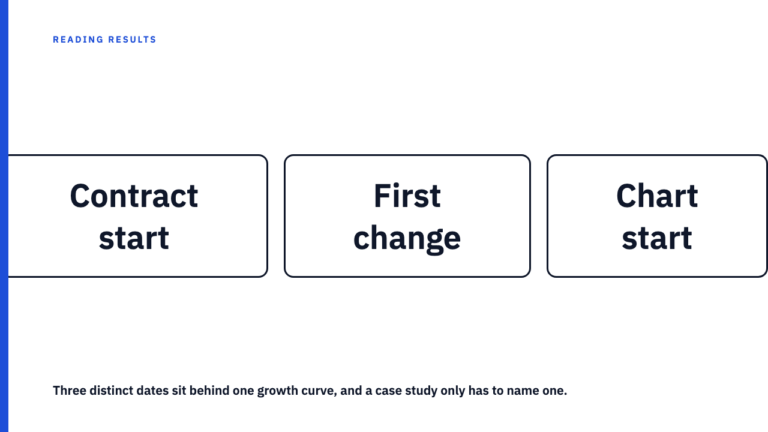
A rising chart in a case study can start climbing before the credited agency’s engagement even began. Here is how to check the start date against the curve.