The counterfactual: the number no case study can show you
You have read the case study, the numbers look plausible, and you still cannot say whether the work caused the result. The quantity that would settle it was never measured.
The comparison you are actually being shown
A lift claim is a subtraction with two terms: the outcome recorded for the period, and the outcome the period would have produced without the work.
Only the first was measured. The second is the counterfactual, estimated openly, chosen quietly, or defaulted to unnoticed. A report claiming an increase measured one number and supplied the other, so the recorded figure can be accurate to the last unit and the claim still unproven.
Why the counterfactual can never appear in the report
This is not withheld disclosure. One version of the quarter happened. The version without the work was never run, so there is no measurement to withhold. Missing data existed and was lost. This was never generated.
A counterfactual conditional describes what would have followed from a condition that did not hold. Causal inference treats each unit as having an outcome under treatment and one without it, only one ever observed. That holds for every case study published, this library included.
What a control group buys, and why marketing rarely has one
A randomised controlled trial manufactures a stand in. Assignment is random, so the groups differ only by chance and by the treatment, and the untreated outcome estimates what the treated group would have done alone.
A client engagement rarely copies that. There is one brand and one account, not a population of assignable units. Organic distribution goes wherever the platform sends it, other campaigns run alongside, and few clients fund a holdout, a slice of the addressable audience deliberately excluded, since that means paying to reach fewer people. None of that makes a case study worthless. It makes it weaker evidence of causation than its framing suggests. Paid media is the partial exception, since a defined slice can be withheld, so the rungs differ by engagement.
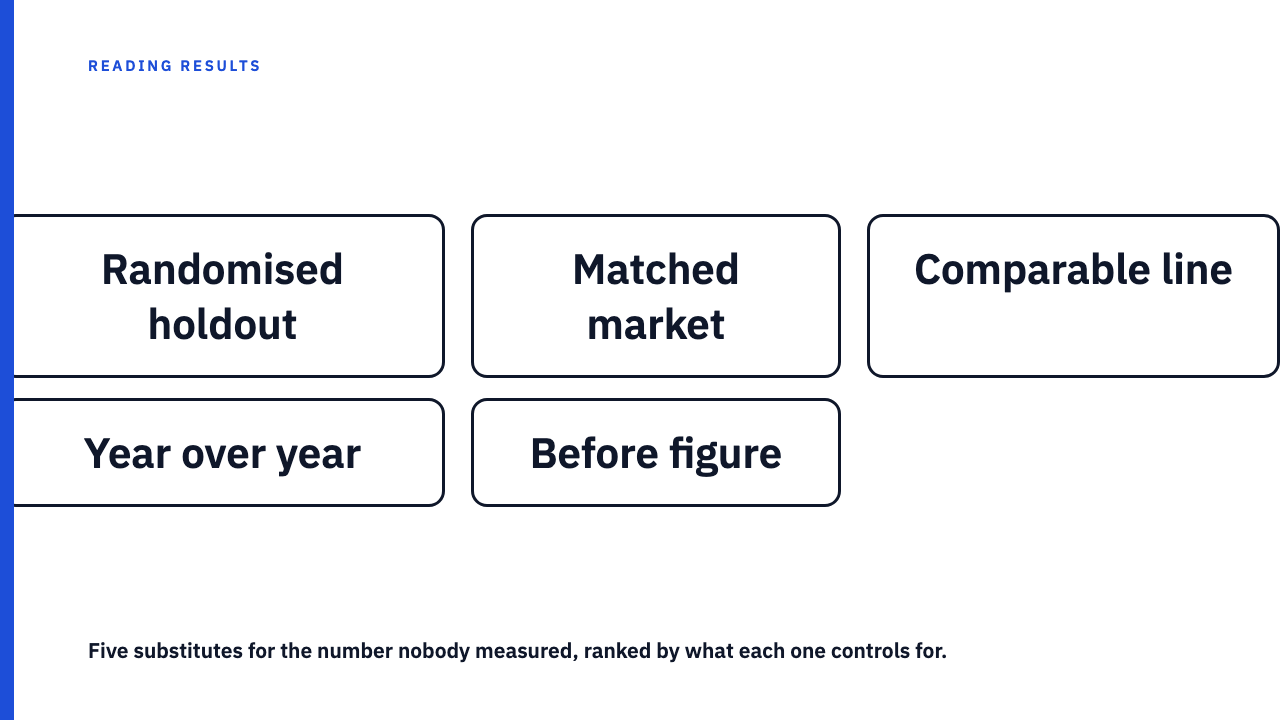
The five substitutes, ranked by what they control for
| Substitute | Controls for | Fails when | Phrasing that signals it |
|---|---|---|---|
| Randomised holdout: a slice of the addressable audience deliberately excluded | Seasonality, platform shifts, other marketing: all hit both groups | The slice is tiny, or the work leaks into it | Names a holdout, suppressed audience, or incrementality test |
| Matched market holdout | Anything time varying reaching both regions | The regions were never comparable, or the work crosses over | Test and control regions |
| Unchanged comparable line | Company wide events, a price change, a PR problem | The lines have different demand curves | A second line’s own before and after |
| Same period last year | Seasonality, nothing else | Anything changed year over year: platform, product, price | Year over year |
| The before figure | Nothing | Always: it assumes rather than measures | Nothing named, before and after by default |
The before figure is not a counterfactual
Comparing after to before assumes the metric would have stayed flat if nobody acted, an assumption about the world rather than an observation. Seasonal demand moves the number, so does a change in how a platform distributes content, and so does other marketing in the same window.
When the work begins matters too. Agencies are hired after a bad stretch, and an unusually low reading drifts back toward its average unaided: regression toward the mean, or the bad quarter that flatters the next one. Selection works above the single study too, since every case study library is a selected sample. A report leaning on the before figure is not dishonest, it may have no alternative. The failure is presenting it as a control.
The same result, read against two different baselines
What follows is hypothetical, invented for illustration, and belongs to no agency and to no case study in this library.
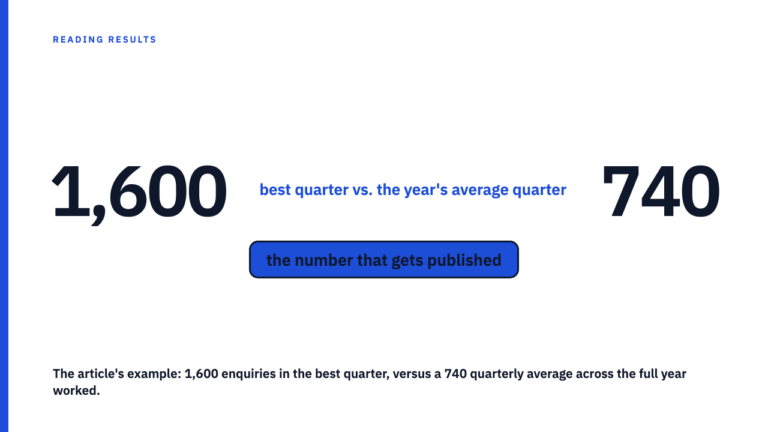
Picture a retailer recording 1,000 enquiries in the quarter before the work and 1,200 during it. Against the preceding period, a gain of 200, or 20 percent. Now suppose a comparable region ran nothing and moved from 1,000 to 1,100 by itself. Untreated rose 100, treated rose 200, so the part attributable to the work is the difference: 100 enquiries, or 10 percent. Neither reading says the work failed. The weaker baseline supports a wider range, not a smaller headline.
Reading for the substitute first
- Search for a named holdout, a control or test region, a comparison group, an untouched period, or the word incremental.
- If nothing is named, the baseline is the preceding period. The claim is unproven rather than disproven, a description of what happened rather than evidence of cause.
- Ask one answerable question: what was this compared against, and what does that comparison not control for.
- Recognise candour: measured against the preceding quarter, which does not account for seasonality, beats caused lift with nothing named.
Where to take this next
Browse the case study library and name the baseline before each result. Reading a case study without being misled covers the rest. If you have published work, submit your own.
FAQ
What is the counterfactual in a case study?
The outcome the same period would have produced without the work. Only one version of the period happened, so it was never observed, and every lift claim compares a measurement against an estimate.
Does a case study without a control group prove nothing?
No. It establishes that the outcome occurred and what was done. It does not establish how much of it the work caused. Unproven and disproven are different verdicts.
What is the difference between reported lift and incremental lift?
Reported lift is the change against the baseline the report chose. Incremental lift is the change against an estimate of what would have happened anyway, and is smaller wherever the baseline rose.
Is a year over year comparison good enough?
It controls for seasonality and nothing else. Platform changes, product changes and pricing changes pass straight through it. Where no untreated comparison exists, it is the best available option.
What is a holdout group?
A slice of the reachable audience deliberately excluded, so its outcome can stand in for the counterfactual. It costs the client reach on purpose, which makes it hard to fund.
How should an agency report a result when no comparison was possible?
Name the baseline, name what it does not control for, and state the result as an outcome rather than caused lift: enquiries rose against the prior quarter, which does not account for seasonality.
Sources
- Counterfactual conditional, 2026-08-28
- Randomized controlled trial, 2026-08-28
- Rubin causal model, 2026-08-28
- Regression toward the mean, 2026-08-28