Geo Test Results Depend on How the Comparison Cities Were Picked
A case study says sales rose 14% in one region compared with “similar markets” that saw no campaign. The phrase “similar markets” carries the whole result, and the write-up rarely explains it.
The claim that sounds more rigorous than it is
The typical shape is a regional lift against “comparable markets”, or “matched cities”, with a percentage and little else. It borrows the logic of an experiment, and that logic is real. A geo test has a genuine design advantage over a before and after comparison: the comparison markets lived through the same season, news cycle and price changes as the exposed ones.
This is a question about execution, not an argument against the method. A geo lift is a difference between two lines, the test market and the control market. Any gap between those lines that existed before the campaign gets counted as an effect unless someone accounts for it. If the control was never a good stand-in, the lift measures the quality of the stand-in, not the campaign. That is a version of the problem in the counterfactual no case study can show you: a control market is an attempt at a counterfactual, and attempts can be good or bad.
A hypothetical: two cities that were drifting apart before anyone ran an ad
This example is hypothetical. The numbers are invented to show the arithmetic and are not a reported result, a typical result or a benchmark. Picture two cities with a weekly sales index. In a four week pre-period the test city was already growing faster, about 3 points a week against 2. Then a campaign ran in the test city for four weeks.
| Week | Period | Test city index | Control city index |
|---|---|---|---|
| 1 | Pre | 110 | 100 |
| 2 | Pre | 113 | 102 |
| 3 | Pre | 116 | 104 |
| 4 | Pre | 119 | 106 |
| 5 | Campaign | 122 | 108 |
| 6 | Campaign | 125 | 110 |
| 7 | Campaign | 128 | 112 |
| 8 | Campaign | 131 | 114 |
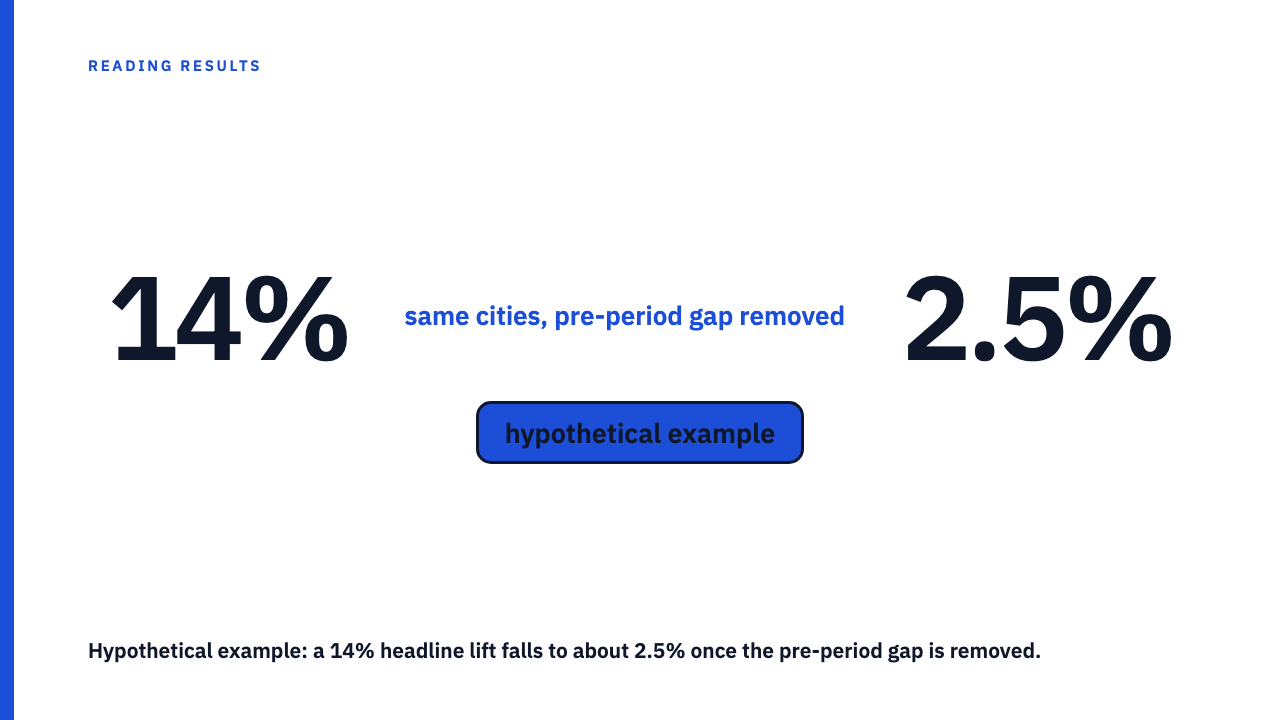
The naive lift uses the campaign weeks alone. The test city averages 126.5 (506 divided by 4) and the control averages 111 (444 divided by 4). 126.5 divided by 111 is about 1.140, so a write-up could report a 14% lift.
Now look at the pre-period. The test city averaged 114.5 and the control 103. 114.5 divided by 103 is about 1.112, so the test city was already running roughly 11% above the control before the campaign. Divide the campaign-period ratio by the pre-period ratio: 1.140 divided by 1.112 is about 1.025. The lift shrinks from 14% to about 2.5%. Most of the headline was the cities drifting apart on their own. The adjustment is crude, since the test city kept pulling away, but it shows the direction of the error.
Pre-period fit: the one number to ask for
Pre-period fit is how closely the control tracked the test market before the campaign started. The pre-period should be long enough to include normal swings, not a few quiet weeks.
On a chart, a good fit looks like two lines moving together through ups and downs: when one dips, the other dips, and the gap between them stays roughly constant. A bad fit looks like lines that sit apart, diverge steadily, or only meet near the start of the test, which is what makes the gap at launch look small. A tight fit over a very short pre-period proves little, so the case study should state its length. I cannot cite a universal length. If a write-up gives none, that is a gap.
Published methodology exists for exactly this setting. The abstract of Estimating Ad Effectiveness using Geo Experiments in a Time-Based Regression Framework describes matched market tests that compare a single control region with a single test region, and a method that predicts the time series of the counterfactual market response. A prediction like that is only as good as the relationship between the two regions, which is why the pre-period matters. I am citing the abstract only.
Who chose the controls, and when
There are two very different answers. In one, the markets were paired by a stated rule before launch, for instance matching on past sales patterns, and someone wrote the rule down with a date. In the other, the agency picked the markets. The first a reader can audit. The second asks for trust, from a party that benefits if the lift looks large.
Agency choice is not automatically wrong. Timing matters more. If several control sets were possible and the one reported is the one that produced the best lift, the result is a selected result. It is the same logic as one variant wins by chance alone: try enough comparisons and one will flatter the campaign. The “before” picture is also a choice.
The question to send is plain: was the market pairing fixed before the test began, and by whom, and what other pairings were considered? A credible answer sounds like a written rule, a date, and a method. An evasive one sounds like “we chose the most representative markets” with no date, rule or alternatives.
A short checklist for reading a matched-market claim
- How many test markets and how many control markets were there, and how were they split?
- Is the pre-period length stated, and does a chart or figure show the markets tracking each other in it?
- Were markets matched on the outcome metric itself, or only on size or demographics?
- Were any markets dropped from the analysis, and why?
- Is a range reported around the lift, or only a single number?
What a fair version of the claim looks like, and what to do when it is missing
A fair version states its markets, its pre-period, its selection rule and its uncertainty. It names the exposed and held-back cities, the weeks of history used, the date pairs were fixed, and a range around the lift. It earns more weight even when the lift is modest.
If those details are absent, treat the lift as an unverified comparison, not a measured effect, and keep the number out of any budget decision. Ask for the pre-period lines or a fit statistic. For the wider standard, see what a trustworthy holdout test requires.
When this library republishes an agency’s geo test result, the numbers remain the agency’s. Browse the case study library to read results with these questions in hand, or submit your own with the markets, pre-period and selection rule included.
FAQ
What is a matched-market test?
It compares markets that saw a campaign with similar markets that did not, and the comparison only means something if the markets genuinely behave alike.
How long should the pre-period be?
There is no universal figure I can state as fact. It should be long enough to include normal ups and downs, and a case study should say how long it used.