What ’97 percent confident’ does and does not tell you
A case study says its winning variant was “97 percent confident”. Most readers hear a 97 percent chance that the change works. The figure usually answers a narrower question.
The sentence the reader hears
Hypothetical, invented for illustration, not a real result: picture a landing page test write-up ending with “variant B won with 97 percent confidence.” No company, agency or real test sits behind that line. You want it to be true, and that is no flaw. The aim is to see what the number has earned, not to wave it away.
The natural reading is “a 97 percent chance B is better.” Whether that is allowed depends on which tool produced the figure, which the case study often does not say.
What a frequentist confidence level actually says
Classical testing assumes the variant did nothing, then asks how often a gap this large or larger would show up by chance if the test were repeated many times. That frequency is the p-value. Some tools, not all, display “confidence” as one minus it, so 0.03 appears as 97 percent. That is a display choice, not a separate finding, and which tool a case study used is exactly what to ask.
What 97 percent does not mean: it is not the probability that the variant is better. A p-value of 0.03 is not a 3 percent chance the result is a fluke. The Wikipedia article on misunderstandings of p-values states that a p-value is not the probability that the null hypothesis is true.
A confidence interval is a different object from a confidence level. As the confidence interval article explains, a 95 percent level describes the method over repeated samples, not a 95 percent probability that the true value sits inside your one interval.
What a Bayesian “probability to beat control” says instead
The Bayesian figure is a posterior probability: given the data and a starting assumption, the chance the variant’s true rate exceeds control’s. As the Bayesian probability article describes, it treats probability as a degree of belief updated by evidence, beginning from a prior.
The prior is an assumption about plausible effects before the data arrive. A different prior shifts the number, most visibly on a small sample, and case studies rarely disclose it.
“Probability to beat control” counts any improvement, even a fraction of a percent, so 97 percent is compatible with an effect too small to matter. Its cousin of the confidence interval is the credible interval, which per the credible interval article states a probability for the parameter given data and prior.
Same headline number, different questions
| Frequentist “confidence” | Bayesian “probability to beat control” | |
|---|---|---|
| What the tool computes | How surprising the data are if nothing changed | A posterior probability the variant beats control |
| Question the figure answers | Would a gap this big often appear by chance? | How likely is the variant better? |
| What it assumes | No true difference, a clean test | A prior, a clean test |
| What it does not say about effect size | Nothing about lift size | Any improvement counts |
| What to ask the agency for | Effect size and confidence interval | The prior and the credible interval |
A case study that only says “confident” has not told you which column applies.
A worked example, hypothetical numbers only
Hypothetical, invented for this explanation, not a reported result. Neither example is from the library or any agency.
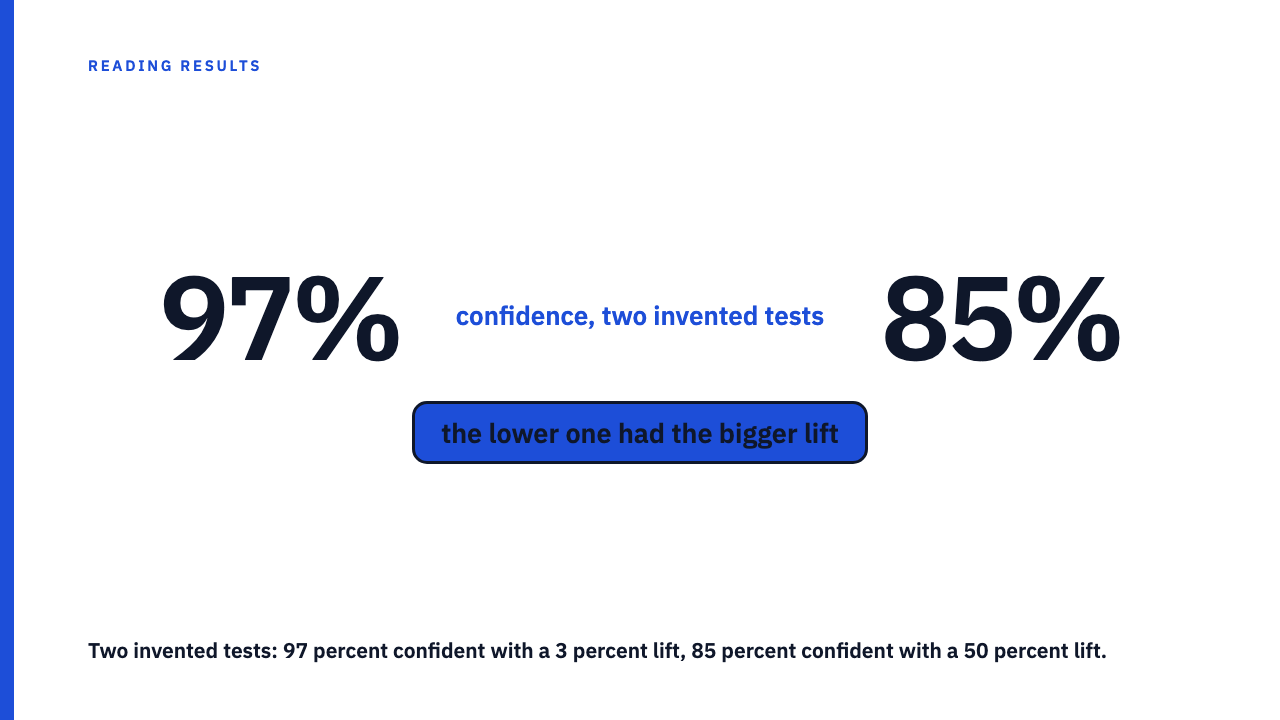
Test one: control converts at 4.00 percent, the variant at 4.12 percent, and the tool reports 97 percent. The absolute gap is 0.12 percentage points, and the relative lift is 0.12 divided by 4.00, which is 3 percent. Is that worth shipping once cost, traffic and the cost of being wrong are weighed?
Test two, also invented: about 500 visitors per arm, control at 4.0 percent and the variant at 6.0 percent, with a tool-reported confidence of roughly 85 percent. The absolute gap is 2.0 percentage points and the relative lift is 50 percent. Confidence is lower than in test one, yet the gap is far larger. On so little traffic the true effect could be much smaller, or negative. Confidence and size move independently.
Size versus significance is covered in significance is not the same as a big result.
What neither figure covers
Both figures assume a cleanly run test, so a number can be 97 percent confident about a flawed comparison. The figure cannot see:
- Whether the test was stopped when the number first crossed the line. See a test stopped early overstates the margin.
- How many variants were tried before this one was shown.
- Whether the metric was chosen after the results were visible.
- Whether the audience was split properly. The companion piece is what a case study leaves out when it names the winning variant, and a lift needs the metric’s normal noise for context.
Repeated peeking and many comparisons both flatter the figure, since each extra look or variant is another chance for noise to cross the line.
Questions to put to the case study
Which method produced the figure, and what were the effect size and its interval, not just the headline probability? What were the planned sample size and stopping rule before the test started? How many variants and metrics were examined, and what was the baseline rate? None of this accuses anyone.
Browse the case study library or submit your own.
FAQ
Is 97 percent confidence the same as a 97 percent chance the variant is better?
Not for the classical figure, which measures how surprising the data are if there were no real difference. Only a Bayesian posterior reads as a probability the variant is better, and it depends on a prior.
Does a high probability to beat control mean a big win?
No. It says how likely any improvement is, not how large it is. Ask for the effect size and its interval.
What should I ask an agency that quotes a confidence figure?
Ask which method produced it and what the effect size and interval were. Then ask what sample size and stopping rule were set up front, and how many variants and metrics were looked at.
Is a confidence interval the same as a credible interval?
No. A confidence interval describes a method over repeated samples, while a credible interval gives a probability for the value given the data and a prior.
Sources
- Confidence interval, Wikipedia, fetched 2026-10-05
- Credible interval, Wikipedia, fetched 2026-10-05
- Misunderstandings of p-values, Wikipedia, fetched 2026-10-05
- Bayesian probability, Wikipedia, fetched 2026-10-05