Platform Conversions Can Add Up to More Than the Orders
Imagine a case study, invented here for illustration, that says a campaign drove 1,400 conversions, and the business it describes only ships a few hundred parcels a week. Before you decide whether that is impressive or impossible, you need to know where the 1,400 came from. Often it is a sum of ad dashboard figures, and that sum can legitimately exceed the number of orders the business received.
One order, three claims
Here is an invented buyer, to be clear that this is hypothetical and not a real result. She scrolls past a social ad on Monday and does not click. On Tuesday she searches for the product and clicks a search ad. On Thursday she opens a link in a marketing email and buys. One purchase, one order in the shop’s records.
Now ask each system what happened. The social platform saw an ad impression and, later, a purchase, so under its own rules it may log a conversion. The search platform saw a click and, later, a purchase, so it may log one too. The email tool saw a click on the final day and logs the sale as well. Each platform reports against its own view of the journey. None of them sees the credit the others have taken. Each can be right by its own rules while the total across all three is three conversions for one order.
Why each platform grades its own homework
This follows from how the platforms document their systems. Meta’s Business Help Center page on its attribution system describes attribution as actions that happen within a number of days after someone viewed or clicked an ad, and says the setting is applied at the ad set level. Google Ads’ page on attribution models describes models that decide how much credit each ad interaction gets for a conversion, and it notes that some older models are no longer supported. Both describe rules and windows applied to interactions with that platform’s own ads.
A neutral tool does not settle it either. Google Analytics’ help page describes an attribution model as a rule, a set of rules, or a data-driven algorithm that assigns credit to touchpoints, and lists its own available models. So an analytics tool applies yet another model, and it will not necessarily match any ad dashboard.
Notice what these pages describe: independent rules, independent windows. Nothing in them says a platform intends to inflate anything. The inference that a purchase touching several platforms can be logged by each is our reasoning from that independence, not a statement any platform makes.
A worked example with invented numbers
Everything in this section is hypothetical. Picture a small online shop, one week, and round numbers chosen for arithmetic, not taken from any real business or case study.
| Source (hypothetical) | Conversions claimed | Alone, plausible? |
|---|---|---|
| Social platform dashboard | 60 | Yes, below 100 |
| Search platform dashboard | 45 | Yes, below 100 |
| Email tool dashboard | 35 | Yes, below 100 |
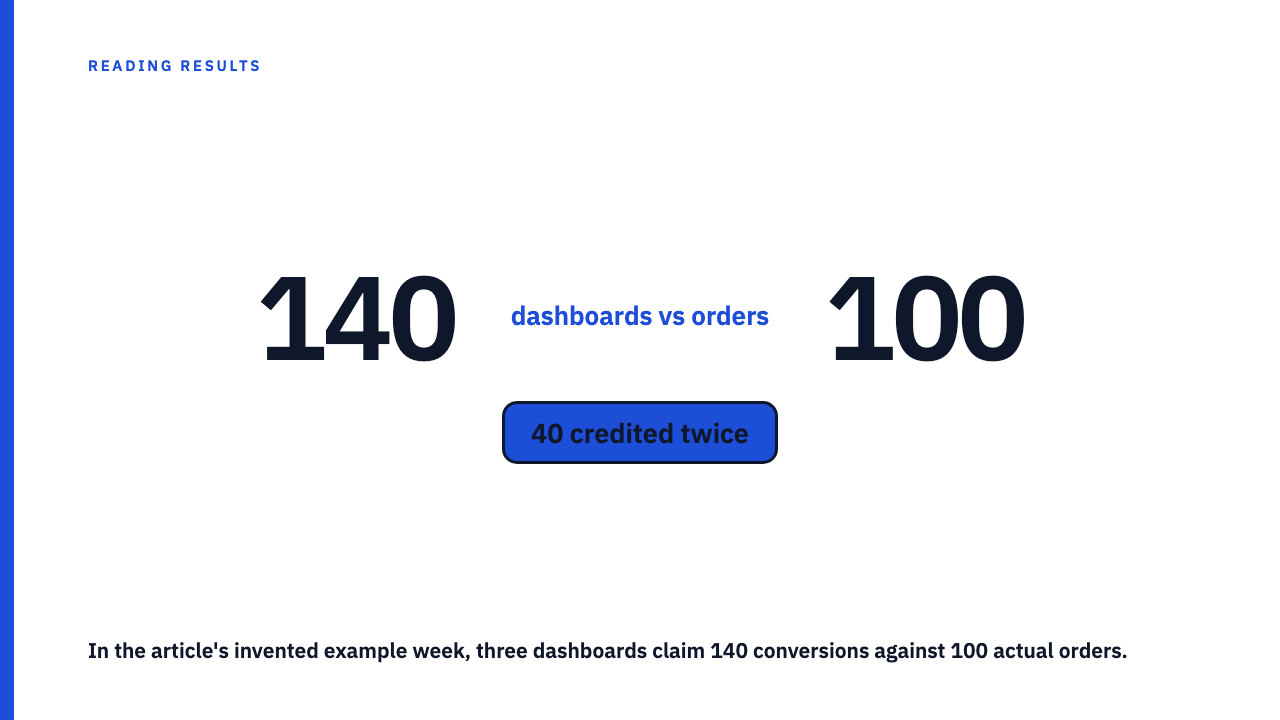
| Sum of dashboards | 140 | Only the sum looks odd |
| Orders in the shop’s own records | 100 | The source of truth |
| Overlap that cannot be real orders | 40 | 140 minus 100 |
Each figure on its own passes the sniff test. Only the sum reveals the problem: 40 of the claimed conversions are repeat credit for orders already counted.
The gap can run the other way as well. Suppose 8 of those 100 orders came through a route no platform saw, such as a customer who typed the address straight in. Then the dashboards together would be covering 92 orders, and the overlap inside their sum would be 48, not 40. A shortfall in one place can hide extra overlap in another, which is why you want the record count and not a guess.
Three ways a case study gives it away
None of these proves an error. Each is a prompt to ask a question.
- A total built by adding dashboard figures. If the headline is the sum of numbers from several platforms and deduplication is never mentioned, ask how overlap was handled. An acceptable answer says the figures were matched against order records, or that the platforms are reported separately and not added.
- One platform’s figure presented as the business result. If there is no order count from the business’s own records beside it, ask for that count for the same dates. An acceptable answer gives the number, or says plainly that the figure is what the platform credited and nothing more.
- A conversion count that looks large for the business. If it seems bigger than the business’s size or stated revenue could support, ask how it squares with revenue. An acceptable answer reconciles the two, perhaps by explaining the conversion is a lead or a sign-up and not a sale.
Reconciling claims against one source of truth
The source of truth is the business’s own order or sales record for the same dates. It is not any ad dashboard, including the one that looks most flattering. Then work in order.
First, match the date range. A dashboard covering a month against an order record covering a quarter tells you nothing. Second, match the definition of a conversion. A purchase, a lead and an add to cart are different events, and the word conversion hides several funnel stages. Third, compare the platform sum to the record count. Fourth, ask about the gap.
A gap is expected and is not proof of dishonesty. Independent credit produces it by design. The useful question is whether the case study discloses the record count and says how overlap was handled. A platform figure can still be a fair measure of that platform’s own reach into the journey. It just is not a business total.
The same trap shows up outside sales. The pattern of summed view counts across platforms is the same arithmetic applied to views.
What the reconciled number still cannot tell you
Suppose the platform sum and the order count line up. That shows overlap did not inflate the count. It does not show the campaign caused the orders. Whether those buyers would have bought anyway is a counterfactual question, and the attribution window is a choice that changes how much credit lands on an ad, a separate mechanism from overlapping credit.
Two more problems sit beside this one. Part of a platform figure may be estimated, which we cover in modeled conversions reported as if measured. And the definition question above has its own write-up, linked earlier. Check those after the counts reconcile.
Keep reading
Browse the case study library to practise this check on published work, or submit your own.
FAQ
Can two ad platforms both take credit for the same sale?
Yes. Meta’s and Google Ads’ help pages each describe applying their own attribution rules and windows to interactions with their own ads, so a purchase that touched both can be logged by each.
Does a platform total higher than orders mean someone is lying?
No. It is the expected result of independent credit. The honesty question is whether the case study discloses the real order count and how overlap was handled.
Sources
- About Facebook’s attribution system, Meta Business Help Center, fetched 2026-09-30
- About attribution models, Google Ads Help, fetched 2026-09-30
- Attribution, Google Analytics Help, fetched 2026-09-30