Twice as Efficient Per Dollar Can Still Be a Smaller Result
A case study says the campaign cut cost per acquisition in half. That sounds like unambiguous good news, but it answers a narrower question than it appears to. It could mean the business landed twice as many customers for the same money. It could also mean the business landed far fewer customers on a much smaller budget, and the ratio simply moved in a flattering direction. Both stories produce the identical headline. The reader cannot tell them apart without one more number than the case study handed over.
The claim and the question it dodges
Cost per acquisition, cost per follower, cost per result: these are ratios, spend divided by results or results divided by spend. A ratio can move in a flattering direction while both numbers underneath it shrink. That is not a trick, it is just what a ratio is. The actual outcomes, customers acquired, followers gained, can fall even as the ratio describing them improves.
So when a case study states “we cut cost per acquisition in half,” the honest response is a specific question: more customers for the same spend, or fewer customers for much less spend? Only a second number can answer it.
A hypothetical case, worked in full
Picture a hypothetical agency reporting on a hypothetical client, not a real company. The numbers below are invented for illustration only.
Scenario A, hypothetical. Spend holds at 10,000. Results rise from 200 to 400. Cost per result moves from 50 to 25, a 50 percent improvement. The business has 400 results instead of 200. Efficiency and volume both improve.
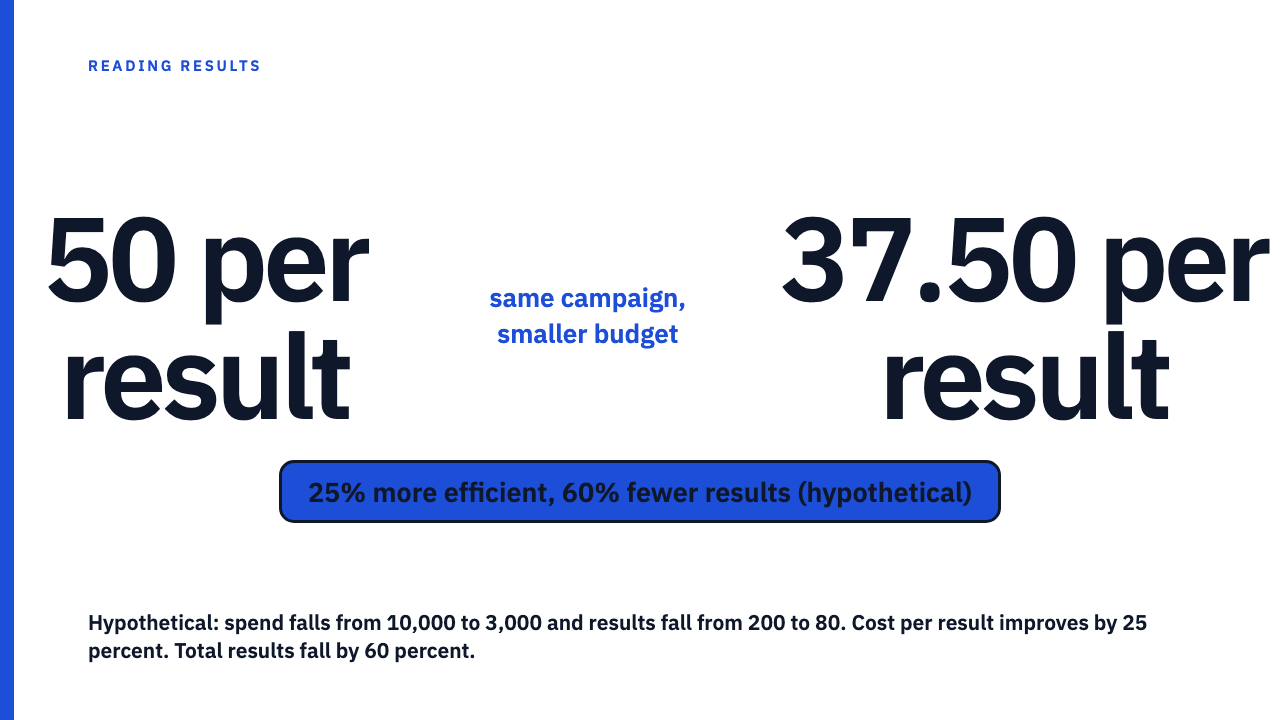
Scenario B, hypothetical. Spend falls from 10,000 to 3,000. Results fall from 200 to 80. Cost per result moves from 50 to 37.50 (3,000 divided by 80), a 25 percent improvement. Total results fell from 200 to 80, a 60 percent drop. The ratio improved. The business has 120 fewer results than before.
Check the arithmetic: 50 minus 37.50 is 12.50, and 12.50 divided by 50 is 0.25, a 25 percent fall in cost per result. 200 minus 80 is 120, and 120 divided by 200 is 0.60, a 60 percent fall in total results. Both are correct at once, because they answer different questions.
The identity underneath both scenarios: cost per result equals spend divided by results. That ratio falls whenever spend falls faster than results fall. No growth has to happen anywhere for the efficiency number to improve. A shrinking budget that shrinks results even faster is enough on its own.
Why the ratio is the flattering number to lead with
When a budget shrinks, the volume number almost always looks worse: fewer customers, fewer leads, fewer followers reads as a step backward. The efficiency number carries no such risk, since it can improve even as volume falls, so it is structurally the more flattering figure to lead with once the period involved less spend.
This is not necessarily deception. A case study built around cost per acquisition may simply be reporting, truthfully, on the metric the client tracked. Agencies do not always control the budget trajectory, and reporting the efficiency figure they improved is not the same as hiding the volume figure they did not. The mechanism is neutral. Working out which story is true is the reader’s job.
The two numbers a cost efficiency claim needs before you can trust it
| Number to look for | Why it is needed |
|---|---|
| Absolute count of outcomes in the period (total customers, leads, or followers gained, not a percentage or a rate) | This is the number the ratio hides. Without it you cannot tell whether results grew, shrank, or held still. |
| Spend level in the same period | Paired with the outcome count, this lets you recompute the ratio yourself and check it against the volume it came from. |
With both numbers, the reader can do the same division shown above and see whether the headline ratio sits on top of a growing outcome or a shrinking one.
Where this shows up beyond cost per acquisition
- Cost per follower: can fall while new followers also fall, if growth spend fell faster still.
- Cost per engagement: can fall while total engagements drop, same mechanism.
- Cost per click: can fall while total clicks drop, if spend fell by a larger percentage.
- Cost per lead: can fall while sales gets fewer total leads than before.
The rule holds across all of them: any “cost per X” or “X per dollar” claim needs the absolute count of X stated alongside it, never implied by the ratio.
How this differs from a shrinking base making a percentage swing wildly
This site has already covered a related but distinct problem, when the base is small, the percentage is just noise: a tiny starting number can make an ordinary change look like a dramatic swing, because the denominator is small. That mechanism is about the size of the base distorting a percentage change.
The mechanism here is different. It is not about a base too small to trust. It is about an efficiency ratio improving while the volume it is built from shrinks, two quantities moving in different directions at once, each true. A related but separate distortion is a return on ad spend figure that ignores what it cost to deliver the sale, where a strong ratio hides missing cost data rather than a shrinking total. Total versus rate gets the same treatment in a cumulative total can rise while the rate behind it falls. For why the flattering number tends to become the headline, see why the best metric on a dashboard is rarely the real story.
Take this question to the next case study you read
The library at Social Case Studies exists so you can practice this on real, credited reporting. Browse the case study library and check whether efficiency claims come with an absolute outcome count. If you have reported a campaign with both numbers intact, submit your own.
FAQ
Can cost per acquisition really improve while the business gets fewer customers?
Yes. It falls whenever spend falls faster than acquisitions fall, as the hypothetical above shows: a 25 percent gain in efficiency next to a 60 percent drop in total results. No growth is required anywhere.
Is a case study lying if it only reports the efficiency number?
Not necessarily. It may be reporting the metric that was tracked. Ask for the absolute count of outcomes before treating an efficiency claim as a business result.
Sources
- socialcasestudies.com/blog/roas-is-not-profit/, checked 2026-09-09
- socialcasestudies.com/blog/small-numbers-big-percentages/, checked 2026-09-09
- socialcasestudies.com/blog/cumulative-total-vs-rate-metric/, checked 2026-09-09
- socialcasestudies.com/blog/multiple-metrics-one-looks-good/, checked 2026-09-09