No Range on That Number? Read It as an Estimate, Not a Fact
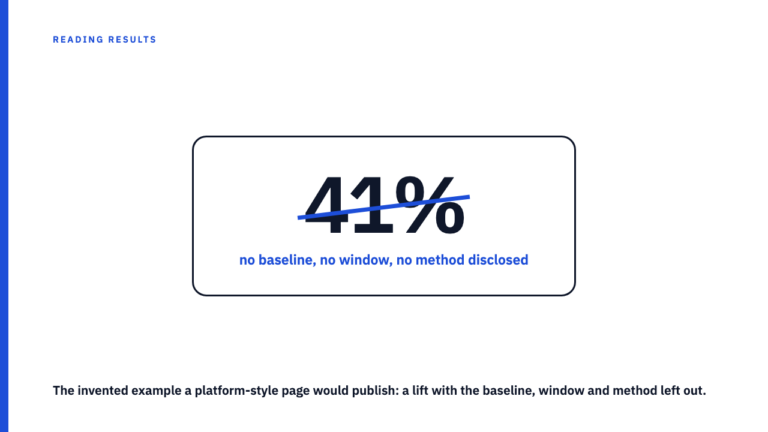
You read a case study and it says the campaign produced a 34 percent lift, or a 2.1x return, with nothing else attached: no range, no error bar, no note about how much that number might move if the campaign ran again. Before repeating it, pause on what that absence means, because it is not what most readers assume.
The number that walked into the room alone
There is a difference between “no range was stated” and “this result has no uncertainty.” A case study making the first claim is not making the second, even though readers routinely collapse them into one. A number with nothing around it did not stop having variance the moment the agency chose not to publish it. The variance is still there, simply undisclosed, different from variance measured and found small.
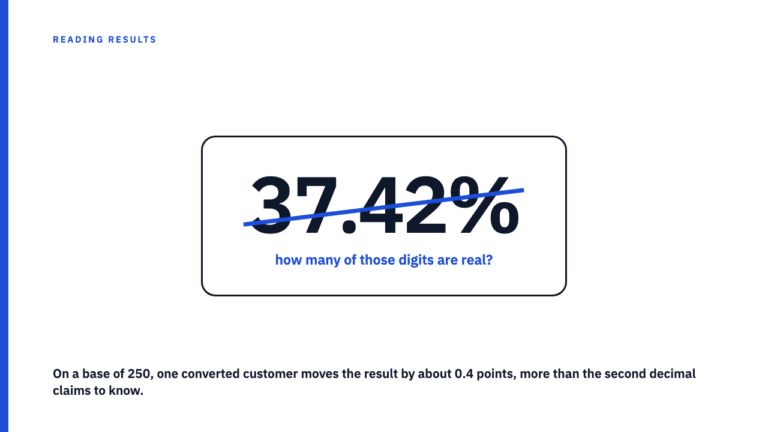
Part of why this slips past readers is how numbers look on a page. A bare percentage reads as finished, with the visual confidence of a fact; a range looks unfinished by comparison. “34 percent” looks more authoritative than “somewhere between 22 and 46 percent,” even though the second tells more of the truth. The range is the more honest object, just the less comfortable one for a headline.
What a range would have told you
A confidence interval, or margin of error, tells you how much the reported number might have wobbled under slightly different conditions: a different week, sample, or slice of traffic. A wide range means the data was thin or noisy; a narrow range means the result held up consistently.
Hypothetical example, not a real reported result. Picture a hypothetical agency reporting a 34 percent lift, stated with nothing around it. Now picture the same result as “a 34 percent lift, with a range of 22 to 46 percent.” Nothing about the campaign changed. What changes is your confidence: 22 to 46 shows the true effect could be a modest 22 or a much larger 46, and the 34 is just the middle of that spread, not a measurement you can bank on. The bare number asks for your trust. The range earns it.
Why the range goes missing so often
A missing range is not, by itself, evidence of anything shady. There are three ordinary reasons. First: no one calculated one, because plenty of agencies report a before and after number without running the data through anything that would produce a confidence interval, and that takes tooling a results deck never included.
Second: the data would not support a meaningful range even if someone tried. A campaign that ran two weeks, or touched a few hundred people, does not have enough observations to produce a range that means much, and silence there is arguably more honest than a range built on too little data.
Third, less flattering but still not lying: including the range would visibly undercut the headline number, and a team choosing which figure to lead with has an incentive to pick the stronger one. That is presentation, not fabrication. A missing range proves an unanswered question, not dishonesty.
Signals that should make you widen the number more, not less
- A small sample or short window mentioned anywhere in the case study, even without a computed range.
- The result described as happening once: one account, one store, one short window, which shows the number is achievable, not how often it repeats.
- Language that leans on the size of the number rather than how measured, usually a sign the method would not survive inspection.
- The “before” side of a before and after claim, described vaguely or not at all: a lift is only as meaningful as its baseline.
A rough way to widen a bare number in your head
Treat any bare percentage as the center point of a range you cannot see, and adjust how wide you imagine it based on what else the case study tells you. This is a reading habit, not a statistical calculation. It will not produce an actual confidence interval, and should never be repeated as though it were one.
Hypothetical example, not a real reported result. Say a hypothetical case study reports a 40 percent increase in conversions. If the sample is described as large and sustained over months, a reasonable mental widening lands close to the figure, say roughly 34 to 46 percent. If the result instead comes from a single short test on a small subset of customers, the same bare 40 percent deserves a much wider range, perhaps 15 to 65 percent, because so little anchors it down. The figure did not change. What changed is how much context told you about how far it might drift, and that context is what to read for.
What to actually say when you repeat the number
When you pass a bare number to someone else, attribute it to the agency and say plainly that no range was given. “The agency reported a 34 percent lift, though they didn’t publish a range” does the job in one sentence.
The number belongs to the agency that measured it. It is not a finding about your own campaign, and should never be repeated as a benchmark. A number without a stated range already carries more uncertainty than it looks, and detaching it from the agency that produced it only adds a second layer.
Where to go next
This habit pairs with a few others on reading a number carefully. See the general guide to reading a case study without being misled for the fuller version, when a small base inflates a percentage for a related check, how a case study number is only as good as what backs it up, and what a case study leaves out when it names a winning variant for the same habit applied to a test. Browse the case study library, or submit your own.
FAQ
If a case study doesn’t mention a confidence interval, does that mean the result is fake?
No. Most case studies never calculate or disclose a range, so its absence is normal and does not mean the number is false. It means the precision is unstated, a different problem than dishonesty. Treat the number as rough, not as made up.
Should I ask the agency for the underlying range?
Yes, it is a reasonable ask. If a number matters enough to repeat to a decision maker, it is fair to ask the agency for the sample size and duration behind it. Even without a formal interval, knowing how much data it rests on lets you judge its precision yourself.