A Case Study Screenshot Is Not the Same Evidence as a Dashboard
Someone hands you a slide with a dashboard screenshot on it. A line goes up and to the right, a number is circled, and the deck moves on before you can ask anything about it. The image looks exactly as convincing as a live dashboard would, and that is the problem worth naming before you decide what the number means. It narrows the general skill in how to read a marketing case study without being misled down to one specific artifact: the screenshot itself.
The picture and the panel it came from
A dashboard screenshot is a frozen render of choices already made before the image existed. Someone picked a date range, a metric definition, a comparison period, and a segment or filter, the software drew a chart, and someone took a picture of it. The screenshot is downstream of all four decisions.
A live dashboard differs in kind, not just freshness. It is a panel of controls: the date picker, metric dropdown, and filter are still there, and you could change any of them and watch the picture change. A screenshot has none of that. The date range and comparison are locked, the metric is chosen, the filter is applied, and none of those four choices survive into the image. You see only their output.
What the image cannot disclose, even an honest one
This is where the argument stops being about honesty and starts being about format. An agency acting in complete good faith produces a screenshot indistinguishable from one built by cherry-picking the single best-looking 30 day window out of a 12 month campaign. Nothing in a static image records why that window, metric, or comparison was chosen over any other. A PNG does not carry an audit trail.
This differs from whether a chart’s own drawn choices mislead, things like a truncated y-axis or a caption placed to flatter a small change. Those concerns are about how a chart someone decided to show you was rendered, and reading a results chart before you read the caption covers that ground. The argument here sits one level earlier: before you judge how well a chart was drawn, the screenshot as an artifact has already withheld the date range, comparison period, metric definition, and filter behind it, and would withhold them just as completely if the chart were drawn perfectly.
A hypothetical: the same account, four screenshots
Picture a hypothetical agency running social accounts for a hypothetical retailer, an entirely fictional pairing invented to illustrate the point, not a real client or a real result. One live analytics account sits behind the scenes, the same underlying numbers the whole time, and four separate screenshots are taken from it.
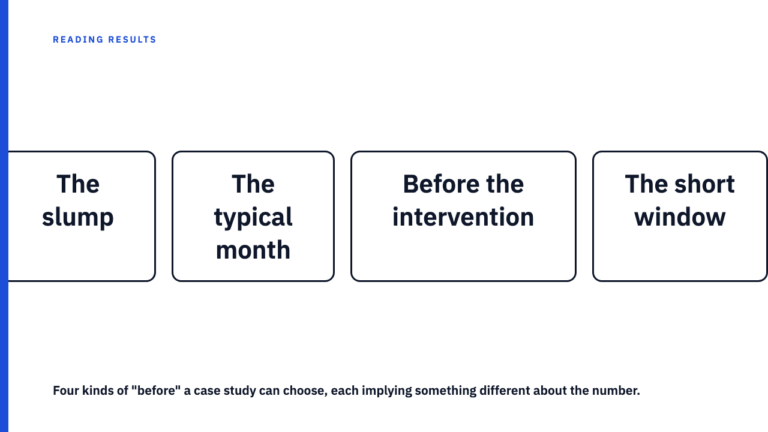
The first covers the 30 days after a product launch, compared to the 30 days before it, and shows engagement rate climbing sharply. The second covers the full year, compared to the same months the year prior, and shows a flatter line, since the launch spike is a small bump inside a longer season. The third keeps the same 30 day window but swaps engagement rate for total impressions, and the shape changes again because the two metrics do not move together in this hypothetical account. The fourth applies a filter for one content format, say short video, to that same window, and shows a different curve again.
None of these four images has been doctored. Each is a truthful render of one legitimate combination of date range, comparison period, metric, and filter, drawn from the same underlying data. Shown alone in a deck, each tells a reader something different. All four would be equally true. All four would be equally incomplete.
The four questions a screenshot cannot answer for itself
Whatever screenshot ends up in front of you, these four questions map onto the four choices baked into it before the image was made:
- What date range does this cover, and who chose its start and end points?
- Compared to what period? A prior month, the same month last year, a pre-launch baseline, or nothing at all?
- What is the exact metric definition being shown? Two reporting tools can define what looks like the same word differently.
- What segment or filter is applied? The whole account, one campaign, one content format, or one audience slice?
The honest response to these questions is never a better screenshot, a cropped version with more axis labels, or a wider timeline. A useful answer is a live view the reader can operate themselves, or an export that states these four things in text next to the numbers.
What actually resolves the doubt, and what does not
Asking for “more context” does not fix the problem. A wider crop or a second slide is still a frozen frame carrying the same hidden choices, just with a bigger border.
What resolves it is a change in what counts as evidence: either a live dashboard the reader can filter and date range themselves, or an export that states its own date range, comparison period, metric definition, and filters in text next to the numbers, rather than leaving them to be inferred from a picture.
This is a reasonable thing to ask of any agency presenting a result, and it is not an accusation. Most screenshots are probably honest. Asking for a live view or a documented export does not claim anyone lied, it recognises that a static image cannot prove either way. It is the same standard behind a case study number is only as good as what backs it up: the number is rarely the problem, what backs it up is.
See for yourself
The library at Social Case Studies exists so readers can compare how different agencies present the same category of result. Browse the case study library, or submit your own if you have one to include.
FAQ
Does this mean every dashboard screenshot in a case study is misleading?
No. Most are probably honest renderings of a real result. The argument is not an accusation against any particular agency or image, it is that the screenshot as a format cannot prove its own honesty either way, which is why the same four questions apply regardless of intent.
What should I ask for if someone shows me a dashboard screenshot?
Ask for the four things this piece names: the date range, the comparison period, the exact metric definition, and any filter or segment applied. Ideally the answer is a live view you can check yourself or a text-documented export, not a second screenshot.
Sources
- https://socialcasestudies.com/blog/reading-a-results-chart/, checked 2026-09-09, HTTP 200
- https://socialcasestudies.com/blog/how-to-read-a-case-study/, checked 2026-09-09, HTTP 200
- https://socialcasestudies.com/blog/self-reported-vs-verifiable-numbers/, checked 2026-09-09, HTTP 200