Revenue growth is not the same claim as new customer growth
Picture a case study that opens with a clean line: sales rose 38 percent during the campaign month. The next paragraph talks about reach, about an audience discovered. A substitution has happened between those two sentences, and nobody announced it. Revenue went up is one claim. New people bought is another, and the first cannot carry the second.
What a revenue number is actually claiming
A percentage or dollar increase in total sales is a statement about a ledger. Money came in, and more of it than in the comparison period. It is silent on who sent it. A first-time buyer and someone who has ordered every six weeks for three years land in the same column.
When a case study credits a social campaign for that rise, it is making a second, narrower claim: the campaign reached people who were not already buying. That is a claim about audience composition, not arithmetic, and it is the claim that makes the campaign look valuable. The number has not earned it.
Analytics tooling does not treat this as subtle. Google Analytics 4 exposes new versus returning as a standard dimension, defined in its published data API schema by previous sessions: zero for new, one or more for returning. It counts users and sessions rather than orders, so the customer-level split lives in the store platform or the CRM, but it is routine in both. Its absence from a case study is a choice.
Where the repeat-purchase revenue was probably already coming from
Ecommerce brands commonly run machinery that produces repeat purchases whether or not a campaign is live. A retention email or SMS flow fires on a schedule tied to the last order. A loyalty program gives a points balance a reason to be spent near an expiry date. A win-back or abandoned-cart sequence chases people who already have an account and a saved card.
None of these need a campaign to work, and their clock does not pause for one. If a win-back sequence hits a lapsed segment in the month a paid push goes live, that revenue lands inside the reporting period and gets credited to the campaign without anyone doing anything dishonest. This is how to read a marketing case study applied to one missing field.
The breakdown a new-customer claim needs
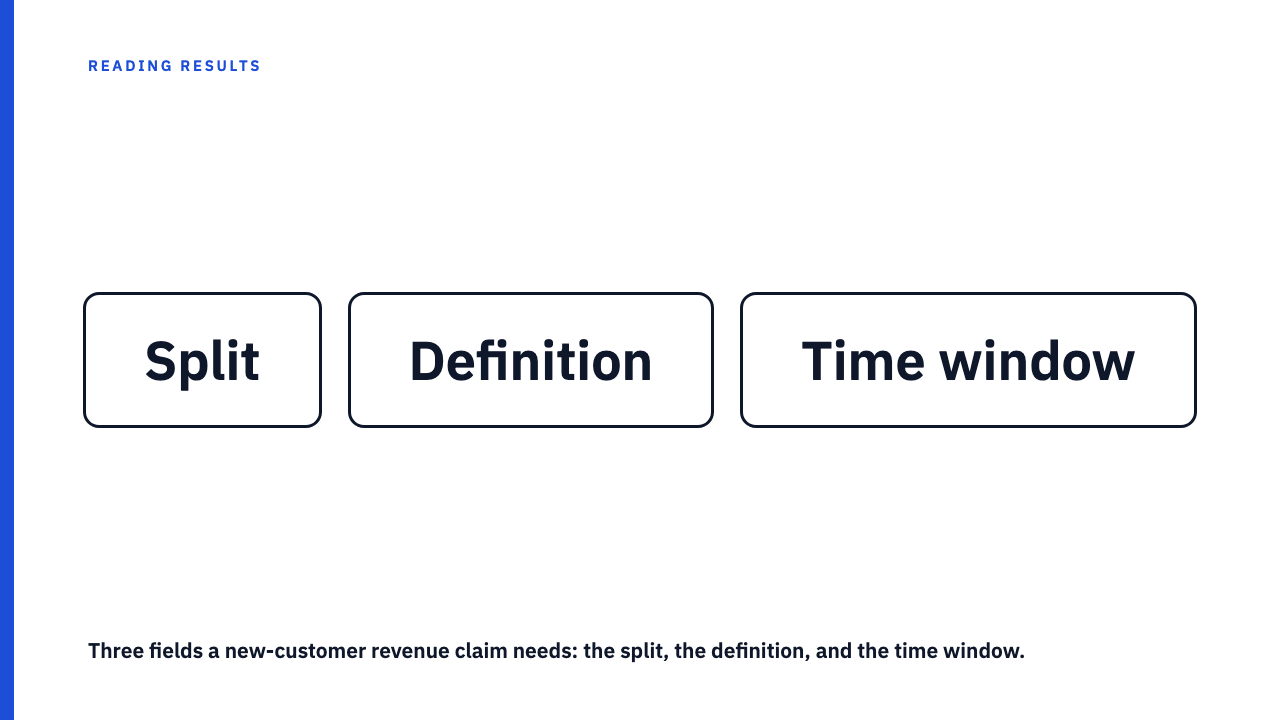
Three fields, and a revenue figure can support a claim about new customers. Without them it cannot.
- New-customer revenue reported separately from existing-customer revenue. Two figures, or two customer counts with the value attached to each. One combined total is not a split.
- The definition of “new” being used. First purchase ever with the brand, or first purchase within the campaign’s reporting window. Only one of those describes a genuinely new customer.
- The time window the definition is measured against. If “new” means no purchase in a prior period, how long is that period? Ninety days and three years produce very different counts from identical orders.
None of this is recoverable afterwards. No reader can split a single revenue total back into its new and existing components, no matter how large.
A hypothetical split, worked through
Every number below is invented for illustration. None of it was reported by any company.
Picture a hypothetical direct-to-consumer kitchenware brand. The month before the campaign it books 500,000 in revenue. During the campaign month it books 690,000, up 38 percent. That is the headline, and it is true.
Now split the 190,000 increase, again with invented figures. Say 150,000 came from customers who had bought before, many of them reached by a loyalty promotion, and 40,000 from first purchases. The new-customer share of the lift is roughly 21 percent, and first-time buyers are under 6 percent of the month’s revenue.
Reverse the split, 150,000 from first-time buyers and 40,000 from repeat purchases, and the headline is identical. Same 38 percent, radically different campaign. The total is compatible with both, so it distinguishes neither.
Questions to ask before crediting the campaign
- How does the document define a new customer? If it means first purchase inside the reporting window, a lapsed buyer returning after eight months counts as new.
- Was a loyalty program, retention flow, or win-back sequence running during the period the figure covers? If the case study does not say, that is an open question, not a no.
- Is the number a share of total revenue, or a figure tied specifically to the new-customer segment? The two look identical on the page and mean nothing alike.
When the case study offers no split at all
A missing split is not evidence of bad faith. Most case studies are written to be read quickly, not to be audited.
It should still move confidence in one direction. Lower it for any claim about audience growth, reach, or acquisition, and leave it alone for the claim about total sales performance, which is a ledger figure and probably accurate. The revenue happened. Who produced it is unestablished.
Two related problems sit next to this one and stay distinct from it: whether the reporting period was chosen to flatter the result, which the attribution window is a choice covers, and whether any of this would have happened at all, which is what a case study can’t show you.
Read a few with this in hand
Browse the case study library and run the three-field test against its revenue claims. If your published work includes the split, submit your own.
FAQ
What is the difference between revenue growth and new customer growth?
Revenue growth is a claim about a total ledger figure across a period. New customer growth is a claim about who bought, specifically people who had not bought before. A rising total is consistent with either, or any mix, and cannot tell you which without a breakdown by customer source.
How do case studies usually define a “new” customer?
Two definitions circulate: first purchase ever with the brand, and first purchase within the campaign’s reporting window. The second counts a returning customer who had not bought recently as new, inflating the figure without anything false being written.
If most of the revenue came from existing customers, does that mean the campaign failed?
No. Bringing lapsed or occasional buyers back is a real outcome, and that revenue is not worth less than anyone else’s. The problem is narrower. A case study should not offer that revenue as evidence of new audience reach without saying which portion of the total it represents.
Sources
- Google Analytics Data API v1 schema, newVsReturning dimension, fetched 7 September 2026.