A Platform’s Success Story Is an Ad for the Platform
You are on a page hosted on an advertising platform’s own business site. A brand logo, two or three large numbers, a warm quote from the brand’s marketing lead, a link to start a campaign. It reads like a case study, and the numbers may well be accurate. The useful question is not whether the page is honest, but what it was built to do.
Two case studies, two different publishers
Two very different documents get called a case study. The first is an agency publishing its client’s results on its own portfolio page, and this site has covered that one: a case study number is only as good as what backs it up.
This piece is about the second kind, hosted on the platform’s own domain in the customer stories section of a business or advertising site. You can recognise the format before reading a word: a short brand narrative, a few headline metrics in large type, a quote from someone at the brand, a note of which ad products were used, and a layout identical to every other story on the same hub. LinkedIn, Snapchat and X all run pages of exactly this shape.
The difference that matters is who reports the number and what they are selling. An agency reports its client’s number and sells its own services. A platform reports a number produced on its own systems and sells ad inventory.
What the platform is actually selling
These pages do not come from a measurement team. They come out of the platform’s marketing or sales organisation, and their job is to move budget onto the platform, not to audit whether the campaign worked.
The incentive differs in kind from an agency’s. An agency wants future clients, so its number has to survive a prospect ringing the featured client to ask about it. A platform wants budget flowing through a channel it owns, this quarter.
Why the selection is not random
Every case study library is a selected sample, and the platform version is that mechanism at much larger scale. An agency picks from its own roster, a small pool of accounts it happened to win. A platform can look across every campaign running on its ad systems that week, flat results and losses included, then feature something from the far right of the distribution.
So the story was not chosen because it is typical. It was chosen because the number was already unusually good, which tells you little about the median result. Someone else’s case study result is not your benchmark.
What these pages tend to leave out
The gaps in this genre are consistent enough to check for directly:
- Whether the lift came from the platform’s own attribution model or an independent one, and whether the model is disclosed at all. The attribution window is a choice, and it is rarely disclosed.
- Whether the brand ran the same campaign on other channels concurrently. Email, search, retail promotion and a press cycle can sit inside the reported period without appearing on the page.
- Whether the metric shown is the one the brand set as its goal, or the one that made the best headline afterwards. A campaign aimed at purchases but written up on reach switched metrics for a reason.
- Whether a specific date range and spend level are stated, or whether the page says “over the campaign period” and leaves both undefined.
A hypothetical worked comparison
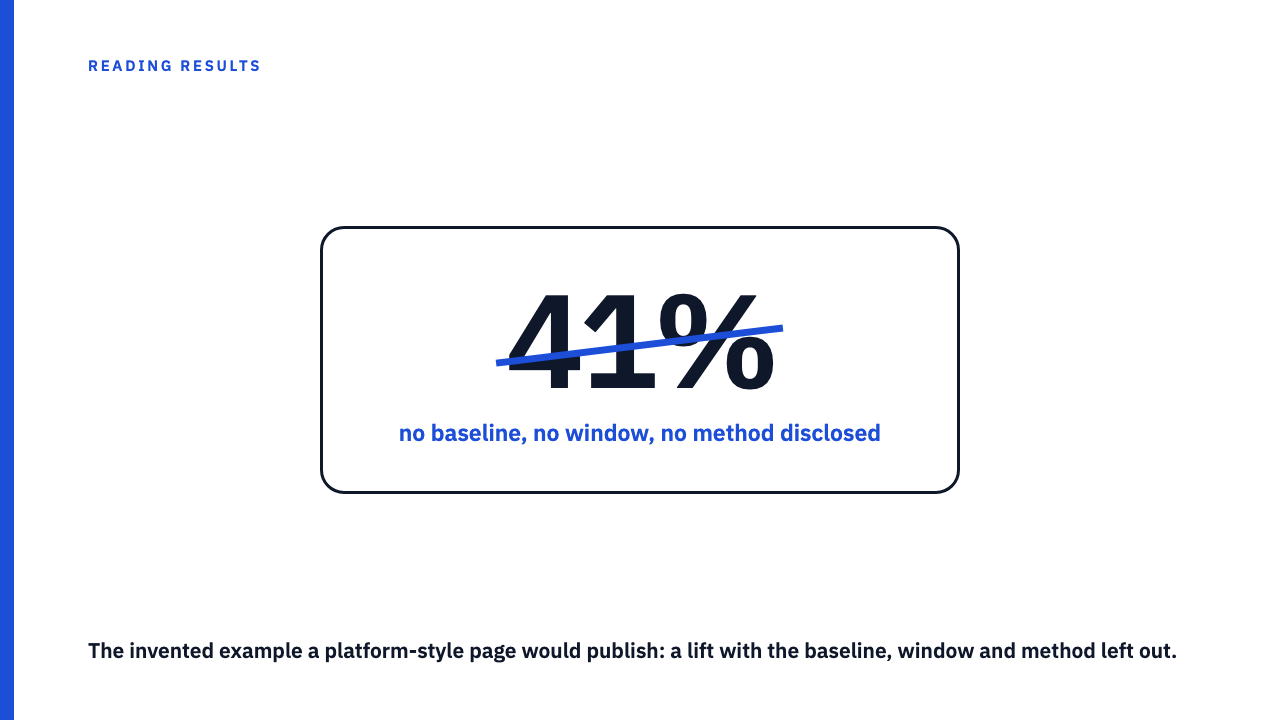
The numbers below are invented for illustration, not a reported result from any brand or platform. Picture a hypothetical outdoor gear retailer running a four week campaign. The platform-style framing is one line: a 41 percent lift in purchases. No baseline, no window, no method. The same invented result, framed fully:
| What is stated | Hypothetical detail |
|---|---|
| Baseline | The prior four weeks, the retailer’s slowest season |
| Date range | Four weeks covering the start of peak season |
| Concurrent activity | A sitewide sale and a paid search push ran in the same weeks |
| Attribution | The platform’s own model, counting views as well as clicks |
Both sit on the same data, and the first is not false. It is missing everything that would let you work out how much of that invented 41 percent the ads caused.
The discount this genre earns, and why it is sharper than an agency’s
“Platforms are biased” is too blunt to use, so state the mechanism. An agency’s incentive is reputational and forward looking: it wants the next client, a relationship that has to survive contact with the featured one. A platform’s incentive is transactional and immediate: it wants budget moving through its own auction now, and you reading the page are the transaction.
The second difference matters more. The platform controls the measurement layer the case study depends on: the attribution model, the conversion window, whether views count alongside clicks, how lift is calculated. An agency quoting a client’s revenue figure from that client’s commerce or CRM system is at least reporting a number produced somewhere it does not control. A platform is marking its own homework and selling the result.
So the question to hold on one of these pages is simple. What would it look like if the campaign had performed averagely, and would it have been published at all? If it would not exist, you are reading a filtered sample of one.
A short checklist for reading one
- Is a baseline stated, and a specific date range, rather than a bare percentage?
- Is the attribution method named, including the window and whether views count?
- Is other marketing activity in the same period disclosed, or ruled out?
- Does the featured metric match what this brand would have set as its goal?
Read a few side by side
The fastest way to calibrate is to read case studies with the publisher in mind. You can browse the case study library, where every result is credited to the agency that reported it, or submit your own.
FAQ
Is a platform-published success story ever accurate?
Often, yes. The number can be correct and still be the wrong number to generalise from, because it was selected out of a very large pool and framed by the party selling the ad inventory. Accuracy and representativeness are separate questions, and this genre is strong on the first and silent on the second.
What is the single most useful check on one of these pages?
Whether a baseline, a date range and the attribution method are all stated. If none of the three appears, you have a testimonial with a number attached, not a measured result.
Sources
- LinkedIn Marketing Solutions, Success Hub customer stories, fetched 7 September 2026, cited for format only.
- Snapchat for Business, Success Stories, fetched 7 September 2026, cited for format only.
- X for Business, Success Stories, fetched 7 September 2026, cited for format only.