How a Rising Total Can Hide a Decline in Every Segment
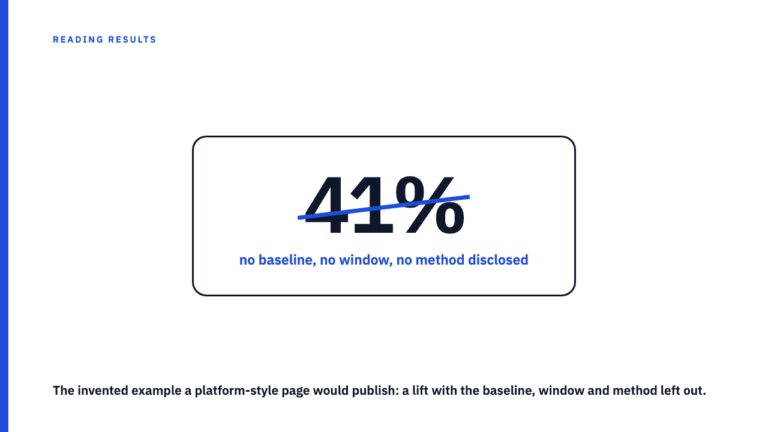
Suppose a case study lands in front of you with one number carrying the whole argument. Blended conversion rate up from 2.0% to 4.1%, no breakdown underneath it. The figure is almost certainly correct, and it can still point you at the opposite conclusion from the one the data supports.
The claim that started this
Give the number the benefit of the doubt. A rising blended total is not a false statement: someone divided total conversions by total visits and reported what they found. Nobody has to be lying for this to go wrong.
What is missing is not honesty. It is a second table: the same metric broken out by whatever groups sit underneath the total, by channel, segment, cohort, geography. Without that, you cannot tell whether the total moved because performance improved or because the composition changed. Your task is not to accuse anyone. It is to work out what to ask for.
A hypothetical worked example
Everything in this section is hypothetical. The numbers are invented, belong to no agency, brand, or published case study, and are chosen to be easy to check rather than realistic. Picture two paid channels across two periods.
| Segment | Visits before | Rate before | Conversions before | Visits after | Rate after | Conversions after |
|---|---|---|---|---|---|---|
| Paid search | 2,000 | 6.0% | 120 | 8,000 | 5.0% | 400 |
| Paid social | 8,000 | 1.0% | 80 | 2,000 | 0.5% | 10 |
| Total | 10,000 | 2.0% | 200 | 10,000 | 4.1% | 410 |
The arithmetic, so you can check it rather than trust it. Before: 2,000 times 0.06 is 120, 8,000 times 0.01 is 80, so 200 conversions from 10,000 visits, a blended rate of 2.0%. After: 8,000 times 0.05 is 400, 2,000 times 0.005 is 10, so 410 conversions from 10,000 visits, a blended rate of 4.1%.
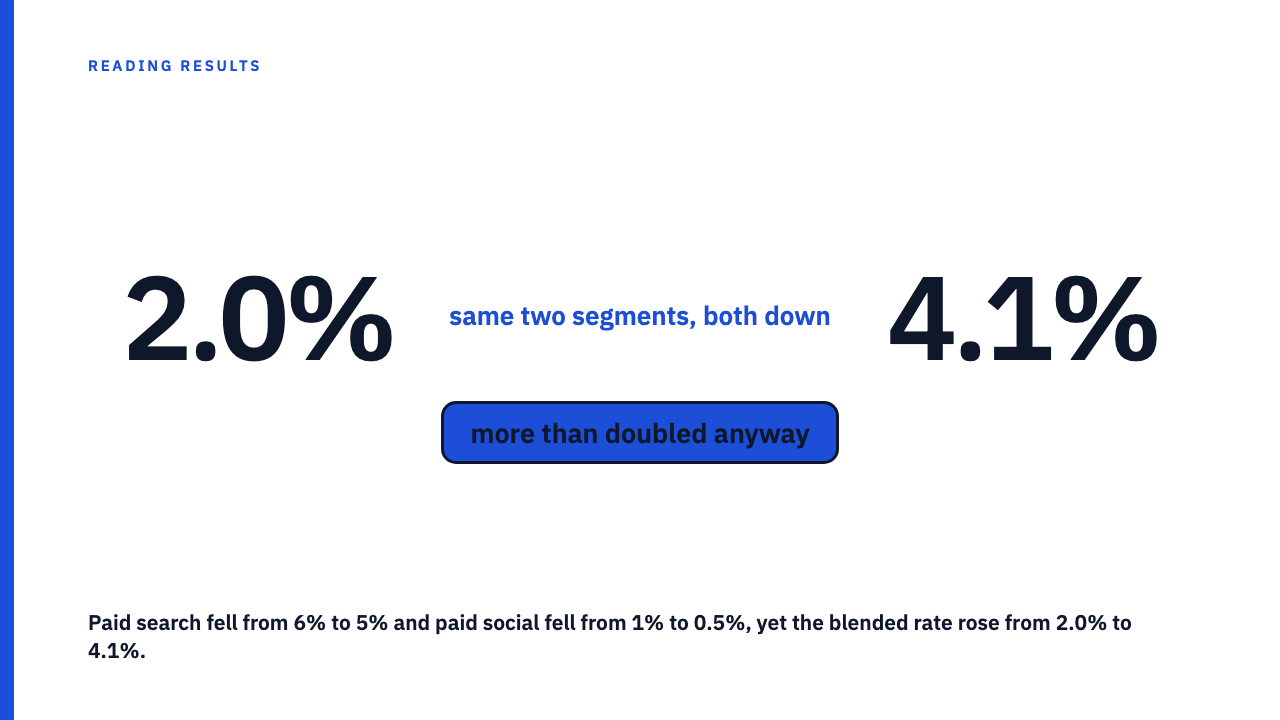
Now the punchline. Paid search got worse, 6% down to 5%. Paid social got worse, 1% down to 0.5%. Every segment declined and traffic did not grow, yet total conversions more than doubled and so did the blended rate. The whole gain came from volume shifting toward the segment still converting better in decline.
Why this is not a trick of arithmetic
A blended rate is a weighted average of the segment rates, so it has two inputs rather than one: how well each segment performs, and how much volume sits in each. Those weights change independently of performance. In the example they inverted, from 20% of traffic in paid search to 80%, and a reweighting that large toward the better converting segment swamps a one point decline in it.
This is the same structural cause behind the statistical phenomenon known as Simpson’s paradox, in which a trend appearing within several groups of data disappears or reverses once the groups are combined. It is a long documented effect in statistics, not a finding of this site’s. One standard explanation is the point above: when group sizes differ sharply, the total is dominated by the larger groups.
The table is a controlled illustration built to make that mechanism visible, not evidence the pattern occurred in any particular case study.
How this differs from a missing counterfactual
These two get conflated constantly. A missing counterfactual is about not knowing what would have happened anyway: seasonality, an unrelated launch, market growth. You accept the number as reported and still cannot tell how much the campaign caused. That argument lives in the counterfactual a case study can’t show you.
Mix shift needs no alternative world. A mix shifted total misleads on its own terms, even if you take the reported figure at face value and ask for no comparison at all. The number is accurate, the period is fair, and the aggregate still describes reality backwards. Closer to the problem where cumulative totals can rise while the rate falls.
The one question worth asking
Can you show me this same metric broken out by segment, channel, or cohort, for both the before period and the after period? Both periods matter, because a breakdown of the after period alone tells you nothing about whether the weights moved. Three follow-ups sharpen it:
- Did the mix of segments change between the two periods? If one channel went from a fifth of traffic to four fifths, the blended number is measuring that shift, not performance.
- Did the definition of a segment change? Reclassifying which traffic counts as a given channel, or what qualifies a customer as new, produces the same masking with no real mix shift at all.
- Is any segment folded into “other” or dropped entirely? A breakdown with a large unexplained bucket, or one whose segments do not sum to the total, is not a breakdown yet.
Where mix shift tends to hide in real reporting
These are categories to ask about, not accusations. None of what follows claims mix shift occurred in any real, named case study.
Channel mix is the obvious one. Geography mix moves when spend enters or retreats from a market with a different baseline. New versus returning customer mix is a quiet one, because returning customers usually convert far better, so any change in that proportion drags the blended rate with it even if neither group improved. Device mix behaves the same way where mobile and desktop convert differently, and campaign or audience mix shifts whenever budget is reallocated mid period. Mix shift does not require anyone to game a number, which is why it survives so many honest reviews, and part of why the best metric on a dashboard is rarely the real story.
Read some results the same way
To practise on published work rather than an invented table, browse the case study library and note which entries break results out by segment. If you have published work of your own, submit your own. New readers can start with how to read a case study without being misled.
FAQ
Is this actually Simpson’s paradox?
It shares the same structural cause, a change in the weighting between subgroups that flips what the combined figure appears to say. The invented example above is not a real observed case, and the Wikipedia article below is the reference for the general phenomenon.
Does this mean the case study is lying?
No, and that distinction is worth keeping sharp. The blended number can be accurate, honestly calculated, and reported in good faith. The problem is what it does not show, not that it is false. Someone can produce a mix shifted total without noticing, so the right response is a request for the breakdown, not an accusation.
Sources
- Simpson’s paradox, Wikipedia, fetched 5 September 2026.