A Lift Measured Only on People Who Saw the Ad Is Not Campaign Lift
You are reading a case study and it says conversions rose sharply among the people who saw the ads. It sounds like proof, but the sentence rarely says who the viewers were compared with, or whether that comparison could be fair.
The sentence in the case study that gives the game away
Here is a deliberately invented sentence, hypothetical and not drawn from any agency or company: “Exposed users converted at 3.5 times the rate of unexposed users.” It reads like a result but only describes two groups, not how they came to exist.
The core problem is simple. “People who saw the ad” is a group partly selected by their own behaviour. It is not the same group as “people we could have shown the ad to.” The first is a filtered slice of the second, and the filter is correlated with buying.
That means the two readings answer different questions. One asks what happened to viewers. The other asks what running the campaign changed. A case study can honestly report the first, but it is easy to let a reader hear the second.
Who ends up in the “saw it” group
Exposure is not handed out at random. Delivery systems, scrolling habits, targeting and prior interest all decide who is reached. Someone already likely to buy is also more likely to be active on the app that day, more likely to be served the ad, and more likely to notice it. The exposed group starts ahead before any ad has had any effect.
It helps to think of three nested populations. Eligible people could have been served the ad. Reached or exposed people were served it or saw it. Converted people did the thing being counted. A lift quoted on the middle layer has already thrown away everyone eligible but never reached.
The unexposed group inside a targeted audience is no neutral yardstick either. It is made of people the delivery system chose not to reach, or who never opened the app. They differ from the exposed group for reasons that have nothing to do with the creative. This is selection bias in its plain form: groups that differ in ways other than the treatment, so a gap between them cannot be pinned on the treatment.
One hypothetical campaign, read two ways (HYPOTHETICAL)
Everything in this section is HYPOTHETICAL. The numbers are invented to show arithmetic and are not a real reported result or a benchmark. The table below sets out one invented campaign, with the same conversions read two ways.
| Group | People | Conversions | Rate |
|---|---|---|---|
| Test side, saw the ad | 40,000 | 1,400 | 3.5% |
| Test side, did not see the ad | 60,000 | 600 | 1.0% |
| Test side, all eligible | 100,000 | 2,000 | 2.0% |
| Holdout side, randomly kept out of delivery | 100,000 | 1,800 | 1.8% |
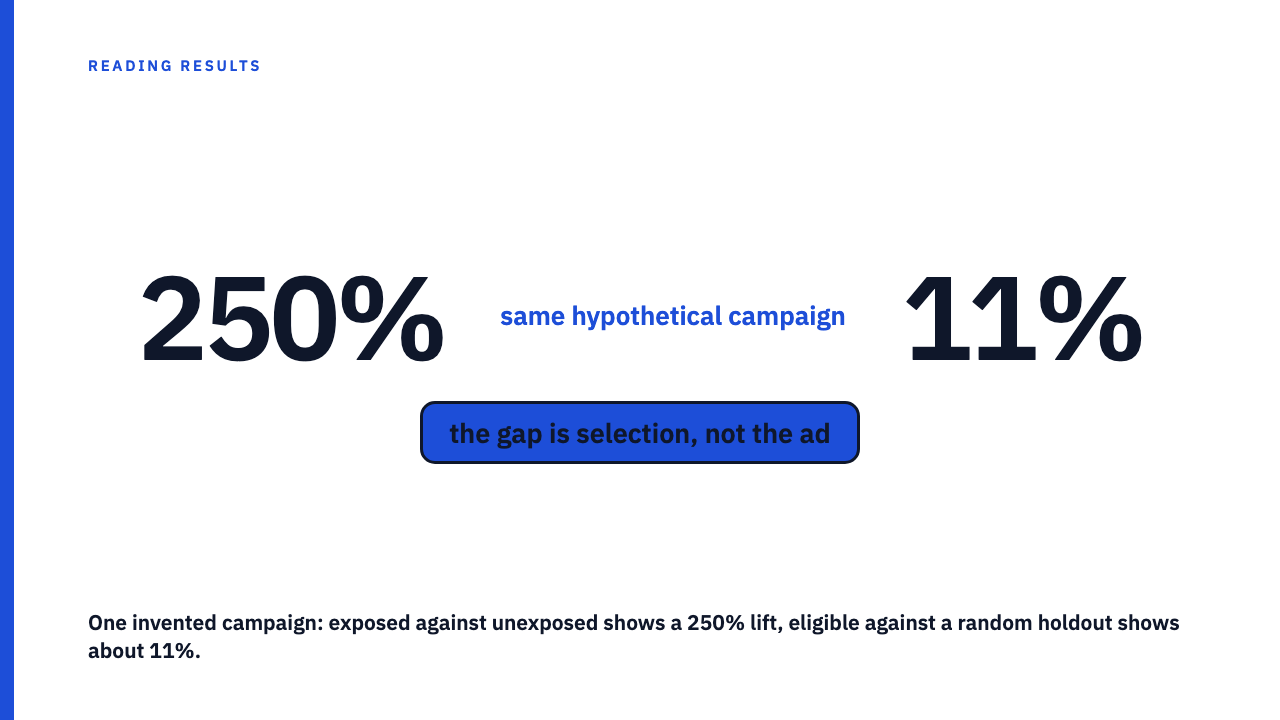
The naive reading compares 3.5% with 1.0%. That is a relative lift of 250%, and a headline could say exposed users converted 3.5 times as often.
The eligible-versus-held-out reading compares 2.0% with 1.8%. That is 0.2 percentage points, a relative lift of about 11%.
Look at what is the same in both columns. The conversions the ad did not cause are present in both, because people who were going to buy anyway are on both sides. The gap between 250% and 11% is therefore the selection effect, not the ad.
If the ad worked only on people it reached and nobody else, the extra 0.2 points would be concentrated in the 40,000. Scaling that up to a per-viewer effect needs an explicit assumption, and a case study should state it rather than leave you to infer it.
What the right comparison is called
Statistics has a vocabulary for this. In intention-to-treat analysis, people are analysed by the group they were assigned to, whether or not they actually received the treatment. In per-protocol analysis, only those who completed the treatment as planned are counted. The Wikipedia article on intention-to-treat analysis sets out both, and it is a general statistics reference, not a marketing standard. The same goes for the pieces on selection bias and randomized controlled trials, the latter describing random assignment as reducing selection bias by balancing the groups.
Mapped to the example, everyone eligible and assigned is the intention-to-treat population. The 40,000 who saw the ad are a per-protocol style subset, kept only because they behaved in a way that put them in view.
The diluted figure is smaller and honest about what the campaign changed. The exposed figure is larger and conditional on having been reached. Neither is wrong if it is labelled for what it is. The trouble starts when the second is presented as the first.
Questions to put to the number
- Lift among whom, and compared with whom? Ask for the size of the eligible population and the size of the exposed share.
- Was the comparison group assigned before delivery, or formed afterwards from people who did not see the ad?
- Are the denominators given at all? A lift with no population stated is a claim that cannot yet be checked.
A good disclosure sounds like this, again hypothetical: “Of 100,000 eligible people, a separate random group of 100,000 was held out before delivery. Conversion was 2.0% among the eligible group and 1.8% among the holdout, a lift of about 11%. Forty percent of the eligible group was reached.”
Where this sits next to holdout design and spillover
How to build a holdout, and what happens when that holdout is contaminated, are covered elsewhere. For the design side, see what a trustworthy holdout test requires. For the idea behind it all, see the counterfactual no case study can show you. Two neighbouring problems: the “before” picture is also a choice, and reach does not mean the same number on every platform. This piece stays on one question: which population the lift was computed over.
A reading rule you can reuse
A lift needs a numerator population and a comparison population, both defined before anyone knew who would convert. If you want to practise on real write-ups, Browse the case study library, and if you are an agency with published work, you can submit your own.
FAQ
Is an exposed versus unexposed comparison always wrong?
No. It describes what happened to viewers, which can be useful. It just cannot be read as the effect of running the campaign, because who saw the ad was partly self-selected, so label it as an observation and not an effect.
What is the difference between people reached and people eligible?
Eligible is everyone the campaign could have served, while reached is the subset actually served or who actually viewed. Lift for the whole campaign is computed over the eligible group, and reached is a behaviour-filtered slice of it.
Sources
- Intention-to-treat analysis, Wikipedia, fetched 2026-10-01
- Selection bias, Wikipedia, fetched 2026-10-01
- Randomized controlled trial, Wikipedia, fetched 2026-10-01