One Journey, Three Attribution Models, Three Different Heroes
A case study says social drove a large share of the conversions. There is a percentage and a tidy chart, and no named attribution model. That share is the output of a rule, and a different, equally defensible rule could have written a different number from the same customers.
The number is a rule, not a reading
Google’s help documentation describes an attribution model as a rule, a set of rules, or a data-driven algorithm that determines how credit is assigned to touchpoints along a path. So an attributed share is a modelling choice presented as a measurement. Someone decided how to split credit, then counted under that decision.
The customer’s behaviour is identical under every model. Only the bookkeeping changes.
This is separate from the lookback window. The window decides which touches are eligible to count. The model decides how credit is divided among the touches that made it in. Google Analytics lists them as separate settings, and the attribution window is a choice covers that half.
Meet the models in one sentence each
- Last touch: all credit goes to the final interaction before the conversion.
- First touch: all credit goes to the interaction that opened the journey.
- Linear: credit is split equally across every touchpoint.
- Time decay: touches closer in time to the conversion get more credit.
- Position based: the first and last touches get the most, and the middle touches share the rest.
- Data-driven: credit is estimated from the account’s own data.
These follow platform documentation. Google’s legacy Universal Analytics page defines first, last, linear, time decay and position based, and is not a description of current behaviour. Google’s current Ads and Analytics pages say first click, linear, time decay and position based are no longer available there. A study reporting one of those either computed it elsewhere or used older data.
Data-driven weights come from data you cannot see, so they are hard to audit from outside. That is the general problem in modeled conversions reported as if they were measured.
Ten hypothetical orders, three answers
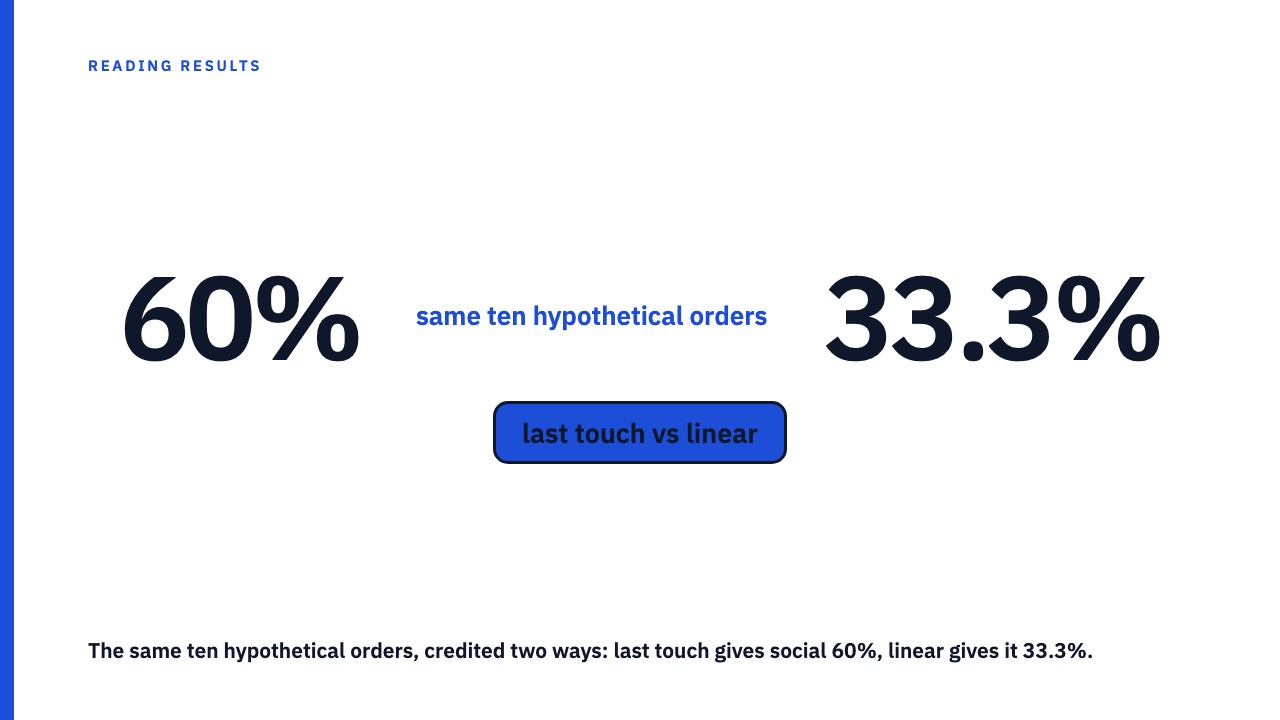
Everything here is hypothetical: invented orders, not a reported or typical result. Each order is worth one credit. In Shape A, six orders, the customer clicks paid search, then email, then a social retargeting ad, then buys. In Shape B, four orders, the customer watches a social video, then opens an email, then clicks paid search, then buys.
| Model (hypothetical) | Social | Search | Total | Social share | |
|---|---|---|---|---|---|
| Last touch | 6.0 | 4.0 | 0.0 | 10.0 | 60% |
| First touch | 4.0 | 6.0 | 0.0 | 10.0 | 40% |
| Linear | 3.33 | 3.33 | 3.33 | 10.0 (rounded) | 33.3% |
| Position based, 40/20/40 | 4.0 | 4.0 | 2.0 | 10.0 | 40% |
Hypothetical: ten invented orders with identical journeys, credited four ways.
To rebuild it: Shape A ends on social and Shape B ends on search, so last touch gives social 6 and search 4. First touch flips that, since A opens with search and B with social. Linear gives each of three touches a third of every order, so each channel gets 10 x 1/3, or 3.33. For position based I used 40 percent to the first touch, 20 to the middle and 40 to the last, the split the legacy Analytics page uses in its example. Platforms can set weights differently. Social gets 10 x 0.4, which is 4.0, and email gets 10 x 0.2, which is 2.0.
Note the email column. It earns nothing under first or last touch and a third under linear. A model can erase a channel as well as promote one.
What the example does and does not prove
It does not show that any model is the truth. The customers behaved identically in every row, so each model answers a different question: what opened the door, what closed it, what was present.
Nor does it show that last touch flatters social. It does here because social sits late in Shape A. Turn the journeys around so social mostly opens them and first touch becomes the generous rule. The swing depends on where a channel sits, not on the channel.
And no model tests whether the sale would have happened without the touch. That gap is the counterfactual no case study can show you.
Questions to put to a case study that reports an attributed share
- Which model produced the number? Platform default or deliberate choice? A default is still a choice nobody revisited.
- Are the model and the window both stated? With only one of them, the result cannot be reproduced.
- Would the claim survive the other models? As a rule of thumb about shape, not a measured fact: if social mostly appears late in journeys, the last touch share is roughly a ceiling and the linear share sits nearer a floor. If it mostly opens journeys, reverse that.
- Is another channel’s number in the same report? If it came from a different model, the comparison means nothing. See also a win that came out of another channel’s budget.
- What can the agency add? The model, the window, and the share under at least one alternative model.
How to read a claim when the model is missing
Two pieces of hypothetical wording, quoted from no real study. Undisclosed: “Social drove 60% of conversions.” Disclosed: “Under last click with a seven day window, social was the final interaction on 60% of conversions; under a linear model the same journeys credit it with 33%.” Only the second can be checked.
Treat an undisclosed number as a bound, not a share of the customer’s decision. If the channel tends to close journeys, read it as an upper bound. If it tends to open them, read it as a lower one. Every number in the library belongs to the agency that reported it.
Read results with the model in mind
Browse the case study library and run the checklist on any attributed share, or submit your own with the model and window stated.
FAQ
Is last touch attribution wrong?
No. It answers a specific question, which interaction came last before the sale. It goes wrong only when presented as the whole cause. It is a rule, and other rules answer other questions.
Does a different model always lower social’s credit?
No. In the hypothetical above, first touch cut social from 60 to 40 percent, but it would raise the share of a channel that mostly opens journeys. Late channels lose credit as a model spreads it out.