Three Years of Revenue Growth Includes Three Years of Inflation
A case study says revenue grew 22 percent over three years, and you would like that to be true. So check the one thing that has nothing to do with the campaign: the dollars at the end of the window are not the same size as the dollars at the start.
One headline number, two different claims
Economists separate two ways of counting the same money. Nominal value is measured in plain money amounts, the dollars as they were counted when they were earned. Real value takes inflation into account and restates the figures in terms of purchasing power. The Federal Reserve describes inflation as a general increase in the overall price level of goods and services, not a rise in the cost of one product.
That general rise is not something a social campaign causes or controls. If prices across the economy climbed and the business’s revenue simply climbed with them, no agency can be credited for that part. So the tell is simple: a revenue figure in dollars, over more than a year, with no word about whether it is adjusted. Read it as nominal until told otherwise.
Every number in the library belongs to the agency that reported it. This post uses no real case, only labelled hypotheticals.
A hypothetical worked example: 22 percent becomes 11.6
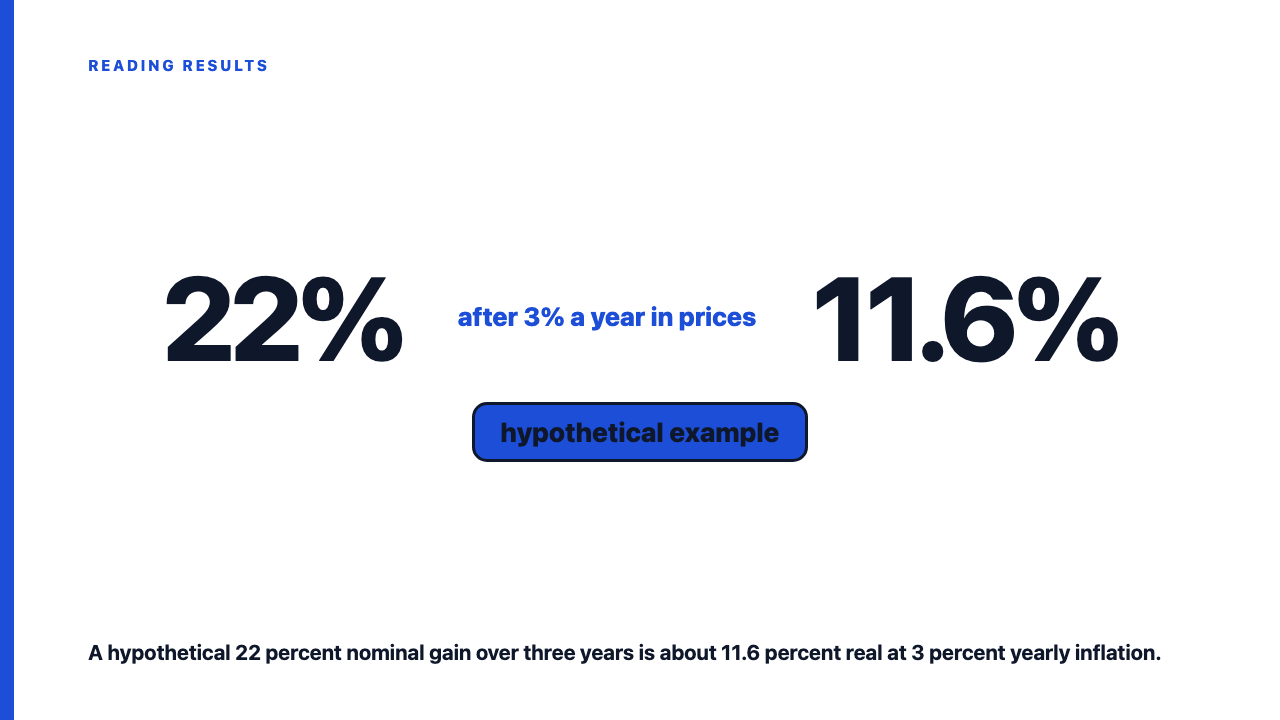
HYPOTHETICAL. An unnamed business has revenue of 1,000,000 in year zero and 1,220,000 three years later. That is 22 percent nominal growth. This is not any real client or result.
Now assume prices rise 3 percent a year across those three years. That rate is chosen for the example. It is not a claim about any actual country or year. Prices compound, so after three years the price level is 1.03 cubed, which is 1.092727, or about 1.093. Revenue is 1.22 times where it began. Divide the revenue factor by the price factor: 1.22 divided by 1.093 is about 1.116. Real growth is about 11.6 percent.
The tempting shortcut goes wrong here. Cumulative inflation is about 9.3 percent, and 22 minus 9.3 is 12.7. That is too high, because the price rise also applied to the growth itself. The correct formula is (1 plus nominal growth) divided by (1 plus inflation), minus 1.
One more angle. Growth of 22 percent over three years is about 6.9 percent a year nominal, which is 1.22 to the power one third. Strip out the assumed 3 percent and the real figure is about 3.7 percent a year. The campaign could own at most that real part, and only if everything else is also stripped out. All of this is HYPOTHETICAL arithmetic, not a reported result.
Why a longer window makes the gap wider
Inflation compounds. Here is the same hypothetical 22 percent nominal growth over three years, tested against three assumed yearly price growth rates.
| Assumed yearly price growth (hypothetical) | Cumulative price change over three years | Real growth (hypothetical) |
|---|---|---|
| 1 percent | about 3.0 percent | about 18.4 percent |
| 3 percent | about 9.3 percent | about 11.6 percent |
| 6 percent | about 19.1 percent | about 2.4 percent |
The same headline can be mostly real growth or nearly all prices, depending on a number the case study never printed. The mechanism needs no motive. A longer window means more years of price change baked into one headline, and the reader cannot tell from the page whether the window was picked for any reason at all. A chosen start and end date is a separate problem.
What deflating fixes, and what it leaves alone
Removing inflation takes out one confounder. Real growth is still not the campaign’s effect. Category growth, seasonality, a launch, and the baseline choice all remain in the number. You still need to check the category, and ask about the counterfactual, meaning what revenue would have done without the campaign.
The adjustment is also an estimate. A consumer price index tracks the prices consumers pay for a basket of goods and services (overview here), and it is not a perfect measure of inflation. A business may face prices that moved differently from that basket. So ask which index was used, and treat the result as an estimate, not a proof.
Two neighbouring adjustments are worth naming and leaving there. A client’s own price increase lifts revenue without selling anything extra. Exchange-rate movement can do something similar to international revenue.
None of this is a gotcha. Adjusting is routine arithmetic, and most of the time it shrinks a result rather than erasing it.
Checking a revenue claim in five minutes
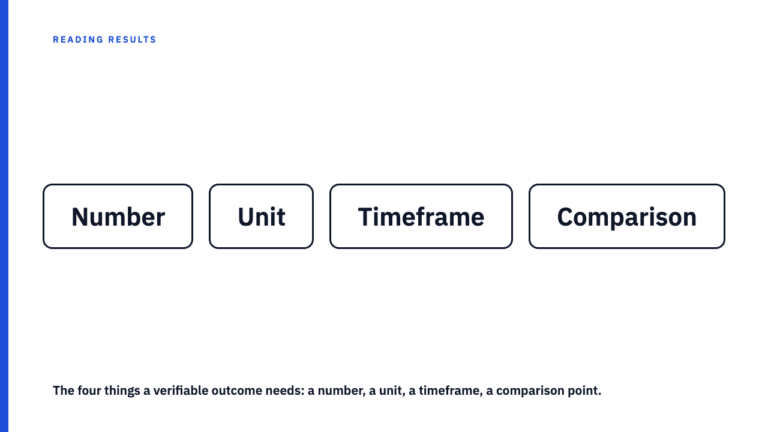
- Find the exact start and end dates of the window.
- Find the two revenue figures and confirm they are in the same currency.
- Look up a published price index for those two dates from an official statistics office. The UK Office for National Statistics is one example of where price index releases are published.
- Divide the revenue growth factor by the price factor.
- Compare the real figure with the headline.
If the case study gives no exact dates, the claim cannot be adjusted, and that gap is worth noting in itself. For a window under about a year the adjustment is small, so the check matters most on multi-year claims.
What an honest version of the claim looks like
An honest version says the figure is nominal. It gives the window, with dates. It then either gives a real figure or names the price index used and the inflation over that window, so a reader can redo the division. And it says the number is the agency’s own. That takes two sentences and closes off the obvious question.
Read more results, and send yours
Browse the case study library to practise the check on published work, or submit your own with the window and the adjustment stated. Next time you see a multi-year dollar figure, ask one thing first: is this nominal or real, and if real, by which index?
FAQ
What is the difference between nominal and real revenue growth?
Nominal growth counts dollars as they were in each year. Real growth restates them at constant purchasing power so price rises are removed: (1 plus nominal growth) divided by (1 plus inflation), minus 1.
Does adjusting for inflation tell me what the campaign caused?
No. It removes one confounder only, so category growth, seasonality, the client’s own price changes and the baseline still need checking, and the counterfactual is still missing.
Sources
- Real versus nominal value (economics), Wikipedia, fetched 2026-09-20
- What is inflation, Federal Reserve Board FAQ, fetched 2026-09-20
- Consumer price index, Wikipedia, fetched 2026-09-20
- Inflation and price indices, Office for National Statistics, fetched 2026-09-20